3 Spectroscopy and Stars
Light from objects is filled with information. By taking the light from an object and splitting it apart into a spectrum, we can decode this light. Spectroscopy is a fundamental tool for astrobiology and allows us to detect exoplanets and study the chemical makeup of their atmospheres. Stars can be classified by their spectra and we can use these classes to understand how much energy different types of stars emit, helping us to determine if a planet around another star could have the right conditions for life.
Learning Objectives
By the end of this chapter, you will be able to:
- Describe how spectroscopy can provide information about an object, such as a star.
- Discuss the difference between continuous, absorption and emission spectra.
- Describe the sequence of spectral types for stars and how they are ordered
- Describe the main stages of life for a low-mass or a high-mass star.
- Explain why the H-R diagram is useful for understanding the properties of different stars.
- Describe the processes that created all of the elements on the periodic table.
Spectroscopy
The most familiar example of spectroscopy is the rainbow of colors that is produced when white light is sent through a prism, as seen in Figure 1. A water droplet can also split up (or disperse) light and create a rainbow when a light beam passes through it. Both prisms and water droplets can serve as spectrometers or spectrographs — tools used to disperse light into a spectrum.
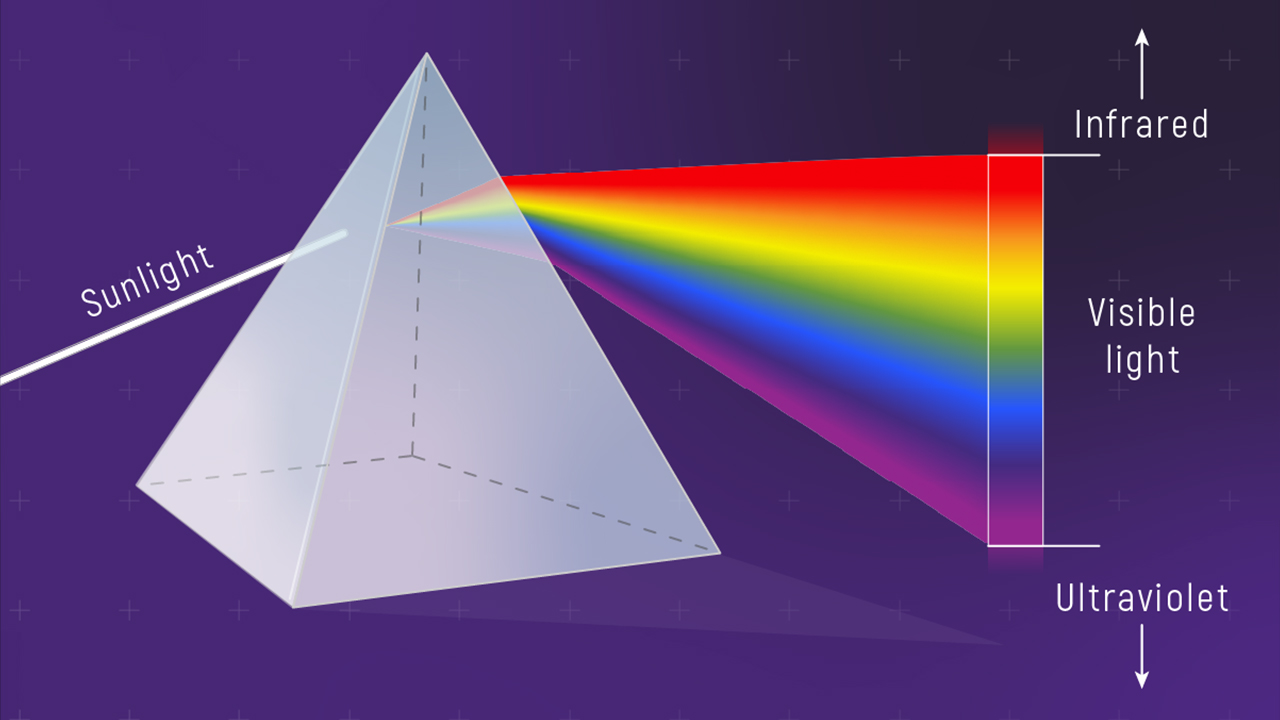
Stars emit all types of electromagnetic radiation but emit the most intense light at a specific wavelength (see Wien’s Law). Note that infrared and ultraviolet light are also emitted by the Sun and are split out as seen in Figure 1 — our eyes just can’t perceive these types of radiation. The distribution of colors, which is naturally organized by wavelength (or frequency), is called a spectrum. There are three main types of spectra: continuous, absorption, and emission as shown in Figure 2. If the shape of the spectrum on the bottom left of Figure 2 looks familiar, it is because you have seen it before when learning about blackbody (thermal) radiation curves.
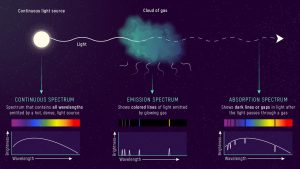
A continuous spectrum looks like the rainbow shown in Figure 1. However, sunlight that reaches the Earth actually is an absorption spectrum, not a continuous spectrum. Why? The Sun does emit a continuous spectrum from its core but some of that light is absorbed by different atoms as it passes through the Sun’s atmosphere. This is shown in Figure 2. On the left, the Sun emits a continuous spectrum at its surface. But that light passes through the atmosphere (the cloud of gas in the middle) and some of that light is absorbed by atoms in the gas. The spectrum on the right is the type of spectrum seen for the Sun, where the dark lines correspond to the wavelengths associated with the atoms or molecules that absorbed the light. Figure 3 shows an absorption spectrum for the Sun, with some of the atoms and molecules present in the Sun’s atmosphere labeled. This spectrum was taken from the Earth’s surface, so the O2 (molecular oxygen) lines are from Earth’s atmosphere.

What does it mean to say “the wavelengths associated with the atoms”? Every element on the periodic table has a different number of protons and thus a different structure. Hydrogen is the simplest atom, with just one proton and one electron orbiting the proton in a neutral atom. To get the electron out of the hydrogen atom entirely requires a certain amount of energy. If there is no energy supplied to the atom, it is stable and the electron is in what we call the ground state of energy. However, the electron can move to different energy levels above the ground state — imagine rungs on a ladder, with the ground state at the bottom and the top rung being the amount of energy needed to kick the electron out of the atom. Hydrogen has a unique set of energy levels and each level has an exact amount of energy. And recall that this energy has an exact frequency or wavelength given by [latex]E=hf = h c/\lambda[/latex]. When light particles (photons) with exactly one of those wavelengths encounters the atom, it is absorbed. And every element has a different set of energy levels, meaning a distinct set of its own characteristic wavelengths. We thus have a very powerful way of learning which elements are inside a star’s atmosphere.
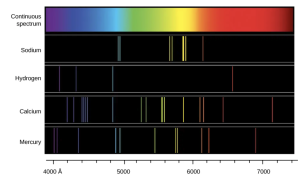
Using the unique pattern of an element to identify whether it is inside of an atmosphere is similar to DNA barcoding used in forensics to identify a match to evidence at a crime scene. Figure 4 shows an example of some of the colors (wavelengths) for a few different elements. No two are the same and we can use these patterns to identify an element in a star or planet’s atmosphere. This same technique is used extensively in biochemistry and many other scientific fields. We can think of the unique emission lines associated with an atom or molecule as its chemical fingerprint.
The middle part of Figure 2 shows the physical idea of how an emission spectrum is created. Let’s say you have a gas made from atoms of just one type of element. If you heat up that gas, the electrons can move up to higher energy levels and then drop back down, emitting light in the process. This is almost the same situation as the absorption spectrum on the left except we are not looking at the continuous source and the gas but instead just at the gas…so there is no continuous spectrum in the background, just the bright lines that correspond to whatever element is in the gas. The atom is emitting energy at the unique set of wavelengths (colors) for that particular element. Of course, the gas can contain many different atoms and molecules at the same time.
You can take a look at the fingerprints for some other elements using the simulation below. Click on any element to see its unique set of spectral lines. Notice that you can choose to see both absorption (top) and emission (bottom) spectra.
Spectral Types for Stars
In 1814 Joseph Fraunhofer studied the spectrum of the Sun and cataloged the dark lines superposed on a continuous spectrum. A decade later, Gustav Kirchhoff and Robert Bunsen (famous for the Bunsen burner) realized that the dark lines in the spectrum were caused by absorption of light in the atmosphere of the Sun. When other stars were observed, they sometimes had different intensities or completely different absorption lines. The absorption lines in spectra provided a quantitative tool for classifying stars.
Want to Know More: The Harvard “Computers”
In 1890, the Directory of the Harvard College Observatory, Edward Pickering, needed a workforce to analyze and catalog the extensive photographic data that had been collected. He employed dozens of women “computers” as his assistants. He believed that these women (unappealingly referred to as “Pickering’s Harem”) were ideal for the job because they did excellent work and they could be paid half the salary of men. Henrietta Swan Leavitt, who classified Cepheid variable stars, and Annie Jump Cannon were two of Pickering’s women computers.
Annie Jump Cannon was nearly deaf throughout her career. She was a suffragist and a member of the National Women’s Party. In 1935, she created the Annie J. Cannon Prize for “the woman of any country, whose contributions to the science of astronomy are the most distinguished.

The Director of the Harvard Observatory, Edward Pickering, obtained spectra for 10,000 stars. He and his staff grouped the spectra according to the strength of hydrogen lines with letters from A through Q. Director Pickering enlisted the help of Annie Jump Cannon, one of his “women computers.” Cannon and Antonia Maury found a more natural ordering that merged the stellar types into the smooth continuous sequence shown in the spectral sequence below in Figure 6. But it was not clear what this classification meant – what physical processes were driving the differences in the spectra?
Annie Jump Cannon expanded the catalog to include more than a million stars, and she developed a new system for spectral classification with seven main groups: O, B, A, F, G, K, M and three classes of peculiar stars. The original classification of stars was in alphabetical form, but it was later realized that the letters needed to be rearranged to sort them by temperature to have a measurable parameter. Each spectral type is further subdivided from 0 to 9 (increasing numbers moving toward the next cooler spectral type). Stars of type O are the hottest and type M stars are the coolest. Our Sun is a G2 star. The Sun is cooler than a G1 star and hotter than a G3 star.
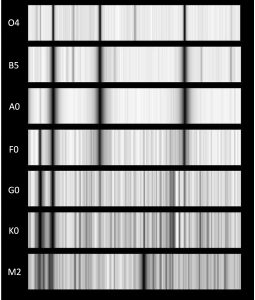
The spectral type sequence OBAFGKM is a temperature sequence. The mnemonic “Oh Be A Fine Girl Kiss Me” is an outdated but still useful way to remember the order of the sequence. The Stefan-Boltzmann law shows that the luminosity of a star is related to its temperature and radius. What determines the luminosity of a star after it is born? The answer is its mass. We’ll go into this more deeply in the Star Formation section, but we note here that everything about a star’s life is determined by the mass of the cloud of gas and dust that it forms from. A massive O or B star races through its fuel and has a short life, while a low mass M star can take trillions of years to use up all of its fuel and die.
For any type of star, the main source of energy comes from the fusion of hydrogen into helium. All stars are made mostly of hydrogen so there is a lot of it to start with — how much depends on the mass of the star. All stars spend the vast majority of their life in this hydrogen-burning phase. Stars in the hydrogen-burning phase are called main sequence stars.
The lifetime of a main sequence star depends on two factors: how much hydrogen exists and the rate of hydrogen fusion. For massive O-type stars, there is 100 times more hydrogen fuel than for stars like the Sun. However, the rate of fusion is so high that the O-type stars burn through this fuel in a million years. In comparison, stars like the Sun will burn hydrogen for about 10 billion years. And the lowest mass M stars will burn hydrogen for more than 100 billion years (since the galaxy is only 13.8 billion years old, there are no M stars that have depleted all of their hydrogen yet). Table 1 shows the different properties of a star in its hydrogen-burning phase.
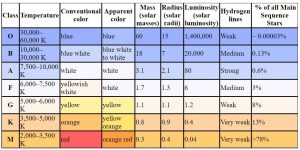
Looking at Table 1 we can note some immediate trends: High mass stars are hotter, more luminous and have a larger radius than low mass stars. Hot stars have a blue color while cooler stars are orange or red.
Concept Check: stellar luminosity
The Sun is a G star.
(a) About how many times more luminous is the Sun as compared to an M star?
(b) Does an O star have a smaller or larger radius than the Sun? By how many times?
Show Answer
(a) 30 (b) the O star’s radius is 15 times larger
The location of the spectral lines in a star’s spectrum can also be used to determine the line-of-sight motion of the star — its radial velocity — through the Doppler effect. We explore this concept more deeply when learning about detecting exoplanets.
Stellar Evolution
Our world has risen from the ashes of massive stars. Those massive stars are rare: they make up just 0.1% of all stars. The synthesis of heavy elements occurs during the final 10% of the lifetime of these stars. Except for hydrogen, the atoms in our bodies were all formed by nucleosynthesis in stars. Without those stars, or specifically without the death of those stars, we would not have the material needed to build planets and needed for prebiotic and biological chemistry.
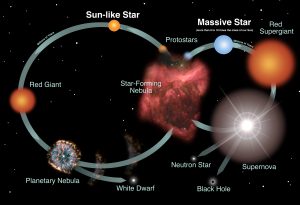
It bears repeating that the the mass of the star is what drives the rate of fusion reactions and therefore the evolution of a star. The definition of “high mass” is generally taken to be around eight times the mass of the Sun. Low-mass stars are much more common, as seen in Table 1. These lower mass stars take the upper path in Figure 7 below and end their lives as compact white dwarfs. Higher mass stars follow the lower path in Figure 7 and end their lives as exotic neutron stars or black holes.
Pressure vs. Gravity
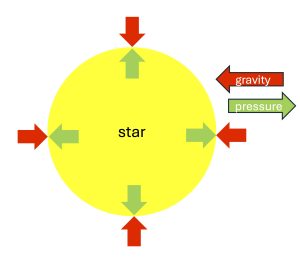
As we discuss the different stages of a star’s life, it helps to keep in mind that from the moment a star is born, there is a competition between gravity and pressure. Gravity tends to make the star collapse in on itself, while thermal pressure tends to push the star apart. When the two are balanced, we say a star is in hydrostatic equilibrium.
A main sequence star is in hydrostatic equilibrium. Throughout its life, stars find a way to keep pressure and gravity balanced. However, as we will see, for the most massive stars gravity will eventually win and create a black hole.
Stellar evolution of low mass stars
Red giants
Roughly 99.9% of the stars are AFGKM spectral type stars. These stars fuse hydrogen in their cores on the main sequence and then evolve into red giants when the hydrogen is depleted. When hydrogen runs out, the core collapses and heats up. The red giant stars puff off about half of their mass (hydrogen enriched with helium, and trace metals like carbon, nitrogen, and oxygen), polluting the interstellar medium like an industrial chimney stack. Pressure takes over as a star becomes a red giant and this causes its radius to swell up to 100 times its size as a main sequence star. The star also becomes more luminous at this stage, as additional heating causes fusion to continue more quickly in a shell around the core.
As the outer envelope of the red giant (confusingly called a planetary nebula because astronomers were originally uncertain about these objects) mixes with the interstellar medium, the core of the remnant red giant collapses. If the core mass is less than 1.4 solar masses, it becomes a white dwarf. This is the ultimate fate of our Sun.
White dwarfs
A white dwarf is about the size of the Earth, and it is an incredibly dense object – one teaspoon of white dwarf material weighs several tons. Nuclear fusion is no longer taking place in a white dwarf (except for a short period of hydrogen fusion on the surface). Here, electron degeneracy pressure supports the white dwarf against gravity. This supporting pressure arises from the quantum mechanical nature of electrons. As is the case with atoms, identical electrons are forbidden from occupying the same energy levels and so are forced into higher energy levels that give atoms and white dwarfs their increasing sizes as the number of electrons increase. As long as the mass of the remnant white dwarf is less than about 1.4 times the mass of the Sun, electron degeneracy can support it against further collapse.
Stellar evolution of high mass stars
Red supergiants
As fragments of a cold molecular cloud begin to contract and form stars, hundreds to thousands of stars are born; however, only about 0.1% of the newborn stars will have enough mass to become O or B type stars. These massive stars contract quickly and carry out hydrogen fusion at a furious pace for 1 or 2 million years. At that point they have burned through their endowment of hydrogen. The core collapses until helium fusion begins and the outer shell expands, forming a red supergiant star. There are several cycles of fuel depletion, contraction, and re-ignition as the core of the red supergiant develops an onion layer structure, with stratified shell burning of different elements. Once the core contains iron, the star collapses again, but iron fusion does not produce energy and cannot support the star against gravitational collapse. Therefore, iron is the end of the line for elements formed via fusion; heavier elements are created during the supernova explosion. After the star explodes as a supernova, the core of the star now hits a fork in the road:
- if the core mass is between 1.4 and 3 times the mass of the Sun, then the star becomes a neutron star
- if the core is greater than 3 times the mass of the Sun, then the star becomes a black hole.
Betelgeuse: ready to explode?
Betelgeuse is a red supergiant star that is 12 – 20 times the mass of the Sun with a radius that is almost 900 times the radius of the Sun. Betelgeuse would sweep out almost to Jupiter if it were the center of our solar system. The star can be seen in the Orion constellation – at the shoulder of the famed hunter. Betelgeuse has been in the news lately, because astronomers noticed that this red supergiant started dimming in October 2019 and think that it may explode as a supernova soon. We have a ring-side seat to watch the evolution of this star, but it is impossible to know if we will see this happen next week, or over the next several thousand years. Because Betelgeuse is 640 light years away, it is possible that the star has already gone supernova and we just haven’t gotten the memo yet.
Credit: Space.com / produced & edited by Steve Spaleta
Neutron stars
Pulsars
As the remnant core collapses into a neutron star, it spins up, conserving angular momentum. In other words, as its radius gets smaller, it spins faster (just like an ice skater spins faster when they pull their arms in). Neutron stars, when they first form, can rotate hundreds of times per second with a narrow beam of electromagnetic radiation that spins with the star like a lighthouse. If the Earth happens to reside in the path of this beam of light, we see the neutron star as a rapidly blinking source – a pulsar. Pulsars were theoretically predicted going back to the 1930s. In 1968, Jocelyn Bell observed radio emission pulses that confirmed the existence of neutron stars.

As an interesting historical side note to Bell’s discovery of pulsars, when the first pulsar was detected, the source of its regular pulses was unclear. The original name for the first pulsar was LGM-1, where LGM stands for little green men. This was considered to be a possible sign of contact from an extraterrestrial civilization.
Pulsars are of additional interest to the search for life in the universe as the first exoplanet detected in 1992 was found orbiting a pulsar. If this seems surprising, given that a pulsar is what’s left after a star explodes as a supernova, it is speculated that the exoplanets may have formed after the explosion.
Black Holes
Electron degeneracy can support a stellar core (or white dwarf) against collapse if the total mass is less than 1.4 Msun. Neutron degeneracy can support a core against collapse if the remnant stellar core is between 1.4 and 2-3 Msun. If the mass of the remnant stellar core is greater than about 3 time the mass of the Sun, there is nothing that can stop the collapse, and a black hole is formed. Nothing escapes the black hole — not even light — so it is very difficult to find these stellar ghosts. But there are about a dozen candidate black holes in binary star systems where the second star is still visible. We can measure the orbit of the visible star and deduce the presence of a massive, but invisible star, and in some cases we can see gas being funneled off the visible star and heated up to tens of millions of degrees as it spirals onto an accretion disk around something that cannot be seen. If it walks like a duck and it quacks like a duck….
Neutron Star Mergers and Gravitational Waves
There is another possible fate for the most massive stars that are part of binary systems. Once they become either neutron stars or black holes, these objects will spiral in towards each other and eventually merge, releasing an enormous amount of energy in the form of gravitational waves. The first gravitational waves from such a cataclysmic event were detected in 2015 with the LIGO instruments. This process is believed to be the source of production for many elements.
H-R Diagram
The different stages in the life of a star are nicely summarized in Figure 7 above. But we have learned an immense amount about the properties of a star — its temperature, luminosity, and radius — and how they vary throughout a star’s life. These properties can be seen dynamically in a figure that shows the luminosity of a star plotted against its temperature. This type of diagram is called the Hertzsprung-Russell (H-R) diagram, in honor of the two astronomers who discovered it around 1910.
Figure 10 shows an H-R diagram. Since the temperature of a star is directly related to its spectral type, the x-axis can show either of these variables. The y-axis shows the luminosity compared to the Sun (notice that the Sun has luminosity of 1 on this scale). The majority of the stars shown fall along the main sequence, which runs from the upper left to the lower right. The main sequence is the phase of a star’s life when it is burning hydrogen into helium.
You can further explore the H-R diagram using the simulation below.
To start, click on “show luminosity class” and plot the nearest stars and the brightest stars. Click on different parts on the H-R diagram (the default, shown by a red X, is the Sun). How does the size of the star change as you move to different luminosity classes?
Want to know more: Luminosity Class
Stars have both a spectral type (OBAFGKM) and a luminosity class (I, II, III, IV, V). Spectral type is directly tied to the temperature of a star. The energy output of a star (luminosity) is directly tied to both temperature and radius. Therefore, two stars can have the same temperature, but they can have different luminosities if their radii are different. You can verify this by locating the star Capella on the H-R diagram in Figure HR. Capella has nearly the same spectral type (and temperature) as the Sun, at G3, but is more than 100 times more luminous. Capella has finished burning through its hydrogen on the main sequence and is now a red giant star.
The radius of a star is constant while it is burning hydrogen – this is the “main sequence” or luminosity class V for a star. Stars of luminosity class V are also called “dwarfs.” When hydrogen is depleted from the core in a star that is similar in mass to the Sun, the core of the star collapses, but the outer envelope expands so that overall, the radius of the star increases. Now, the star evolves across the subgiant branch (luminosity class IV) and the surface temperature cools as the star expands. Even as the outer envelope of the star is increasing, the core of the star is collapsing; when the pressure is high enough in the core, helium fusion begins and the star enters the giant phase (luminosity class III). Stars that are more massive than the Sun will evolve from class V to giants (class III) or supergiants (class II or class I) depending on their mass. There are also subdwarfs (luminosity class VI) and white dwarfs (luminosity class VII) but by convention, those luminosity classes are not often used. Instead, those stars are usually just called “subdwarfs” or “white dwarfs.”
Here is a summary of the luminosity classes:
-
- I – supergiants
- II – supergiants
- III – giants
- IV – subgiants
- V – main sequence (dwarfs)
Assembling the Periodic Table
In discussing spectroscopy and stars, a couple of facts can be highlighted: (1) all stars are made mostly of hydrogen; (2) every element has a unique “chemical fingerprint,” or distinct set of spectral lines. We can ask a question related to both of these points: Where did all of the elements in the universe come from?
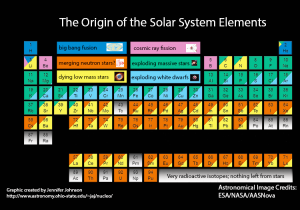
Following the Big Bang, the only atomic elements that existed in the early universe were hydrogen, helium, and a small amount of lithium. All other elements in the periodic table were formed later through nucleosynthesis and the mergers of neutron stars. Since we need those other elements to form planets and life, we review and summarize the processes that form these elements.
Nucleosynthesis
Nucleosynthesis is the process of building up heavy elements from lighter elements through fusion. In the Sun and other stars, the most common atom is hydrogen. It is possible for hydrogen nuclei (protons) to overcome the strong electrostatic repulsive forces because of the enormous temperature and pressure in the core of a star and fuse into heavier nuclei. The energy output of the Sun is 3.8 x 1026 W or 3.8 x 1026 J/s (one watt is equal to 1 joule of energy every second). This energy comes from the fusion of hydrogen into helium in the core of the Sun.
Theories of nucleosynthesis inside stars are able to predict the relative abundances with which the elements occur in nature. The way stars build up elements during various nuclear reactions really can explain why some elements (oxygen, carbon, and iron) are common and others are quite rare (gold, silver, and uranium).
Want to know more: Hydrogen Fusion
The exact pathway for nucleosynthesis is very temperature-dependent. In a star like the Sun (or less massive than the Sun), the process is proton-proton (or p-p) fusion and follows the steps outlined in the animation below.
In addition to making helium, the p-p chain produces the energy that supports the Sun against collapse. One reaction cycle in the p-p chain produces 25 MeV of energy (eV are a very tiny unit of energy… 25 MeV is just 4×10-12 joules of energy). In the second step of the p-p chain, a proton is transformed into a neutron. How does that happen?
In the first step of p-p nucleosynthesis, a small fraction of hydrogen transforms into deuterium (an isotope of hydrogen with a neutron added to the nucleus, written as 2H). This is the rate-limiting step in the p-p chain because the transformation of a proton into a neutron is statistically improbable. Once deuterium is created, the rest of the p-p pathway proceeds relatively quickly.
As hydrogen fusion occurs in the Sun, most of the mass of the hydrogen is converted into an “ash” of helium. However, there is a slight difference of 0.71% between the mass of 4 protons and the mass of a helium nucleus; this fraction of the original mass is converted into energy and the mass loss rate from the Sun, [latex]\Delta m[/latex], can be calculated with Einstein’s famous equation:
[latex]E = \Delta m c^2[/latex]
where $c$ is the speed of light. We can solve this equation for $\Delta m$ and find how mass is converted into energy every second in the Sun:
[latex]\Delta m = \frac{E}{c^2}[/latex]
[latex]\Delta m[/latex] = (3.8×1026 J)/(3×108 m/s)2 = 4×10⁹ kg = 4 billion kg
Think about that… every second, 4 billion kg (or 4.4 million tons) of the mass of our Sun vanishes — it is transformed into energy that is radiated away. However, this represents only 0.71% of the mass of hydrogen that is converted into helium. How much hydrogen is being burned in the sun every second?
[latex]m_{H}[/latex] = (4×10⁹ kg)/(0.0071) = 5.63×10¹¹ kg = 563 billion kg [latex]\sim[/latex] 600 million tons
To produce the Sun’s luminosity of 4 × 1026 watts, some 600 million tons of hydrogen must be converted into helium each second, of which about 4 million tons are converted from matter into energy. As large as these numbers are, the store of hydrogen (and thus of nuclear energy) in the Sun is still more enormous, and can last a long time—billions of years, in fact.
Stars that are more massive than the Sun have more gravitational pressure in their cores and hotter temperatures. Massive stars that have trace amounts of carbon, nitrogen, and oxygen (CNO) can take a more efficient path for synthesizing helium, using CNO as catalysts to form helium nuclei . The energy yield is higher and therefore more efficient: 26.72 MeV per helium nucleus instead of 25 MeV per helium nucleus with the p-p pathway.
Manufacturing heavier elements
So, if hydrogen fusion is forming helium, how does that get us to carbon, oxygen, nitrogen, phosphorus, sulfur…. all the good stuff that we need for life? Stars on the main sequence (dwarfs) burn only hydrogen in their cores. Elements with atomic masses greater than helium can be formed only after the star leaves the main sequence. After most of the hydrogen in the core has been fused to helium, hydrogen fusion slows down. This is a problem for the star because H-fusion was supporting the star against gravitational collapse. As the rate of H-fusion declines, gravity begins to win, and the core of the star collapses. This causes the pressure and temperature to increase. When the pressure and temperature are high enough, helium fusion in the core is initiated. During this gravitational collapse, the pressure and temperature of hydrogen gas in a shell surrounding the core “reignites” and begins forming helium.
Next, the helium nucleus (a.k.a. an alpha particle) fuses into carbon and oxygen. For low mass stars (masses less than about 3 solar masses) this is the end of nuclear fusion reactions. Low mass stars do not form most of the elements that we need for life. For this, we need high mass stars.
Massive stars are rare with relatively short lifetimes (millions rather than billions of years). But, massive stars do all of the heavy lifting when it comes to manufacturing high atomic mass elements. Like their lower mass counterparts, massive stars burn hydrogen on the main sequence. But when hydrogen fusion ends, there is a rapid succession of fusion and collapse events. When the core depletes the element it is burning in the core, gravity squeezes the star, and the next stage of core nuclear fusion along with shell burning of lighter elements begins. Close to the end of its life, the massive star has developed a stratified, onion skin structure with the heaviest elements in the core and surrounding shells of successively lighter elements, as shown in Figure 11 below. However, that fusion stops when iron is formed in the core. For elements with lower atomic mass than iron, fusion reactions are exothermic – they give off energy and support the star against gravity. Iron fusion is endothermic – energy is used in this reaction. In other words, iron is not capable of fusing to a heavier element.
The next move belongs to gravity. Once the core collapse begins, the onion shells in the core mix, and the density increases. The outer layers of the star fall in, hit the high density core, and bounce off in a fierce supernova event that blows out about half of the material in the star. During the supernova, the shock waves generate high enough pressures to produce the heaviest elements in the periodic table. The final distribution of elements has some interesting structure. The addition of alpha particles favors production of even-numbered atomic mass elements and leaves behind an even-odd pattern in the logarithmic elemental abundances. There is an obvious iron peak in the elemental abundances with higher-mass elements being increasingly rare.
Key Concepts and Summary
The wavelengths of light encode the energy and chemical composition of stars and other celestial bodies – astronomers use spectrographs to disperse light collected at a telescope into a spectrum. Objects emit a continuous (sometimes called “blackbody”) spectrum with an intensity distribution that depends on temperature. When atomic transitions take place in cooler outer layers of stars, the spectrum can also have absorption or emission lines. Absorption lines occur when atoms absorb photons of light pushing electrons to a higher energy state. Emission lines occur when atoms release photons and the electrons cascade to a lower energy state. The process of absorption (and emission) is sensitive to temperature, so the peak intensity, coupled with the spectrum of a star reveals its temperature and the chemical composition. Stellar spectra have been organized into a temperature sequence: OBAFGKM, from the hottest to the coolest stars. Stars like the Sun burn hydrogen in their cores for about 8-9 billion years – our middle aged Sun is halfway through this process. Once the hydrogen in the core has been fused, the star begins to evolve through a giant phase, fusing successively higher atomic mass elements to produce the elements in the Periodic Table. Stars end their life as a white dwarf, neutron star, or black hole, depending on the mass of the star.
Review Questions
Summary Questions
- How does spectroscopy give information about an object? What happens when starlight passes through a prism?
- What are the differences between continuous, absorption and emission spectra? What are the similarities between all three?
- Why are the spectral lines for an element sometimes called “chemical fingerprints”?
- What does the spectral type of a star depend on? Why isn’t the sequence of spectral types alphabetical?
- How does the lifetime of a star depend on its mass?
- Explain how thermonuclear fusion in the core of a star creates energy. Which element is being fused when a star is on the main sequence?
- Describe the five main luminosity classes for stars. What luminosity class is the Sun? Betelgeuse?
- What is displayed on a H-R diagram? How does an H-R diagram help us understand the properties and evolution of stars?
- How do the spectral type and luminosity class of a star differ from each other?
- How were the elements on the periodic table created? Explain a few of the different processes and how elements were created (nucleosynthesis).
Activities
- H-R Diagram simulator. Open the H-R Diagram simulator above (or you can open it in a separate window at https://astro.unl.edu/classaction/animations/stellarprops/hrexplorer.html).
- Click on “show luminosity classes”; next, plot the nearest stars and then plot the brightest stars. Why do the nearest stars and brightest stars fall into different regions on the H-R diagram?
- Look up the temperature and luminosity for the star Vega (be sure that the temperature is in K and that the luminosity is reported relative to the Sun) and enter them in the boxes in the “Cursor Properties” box on the left. How do the size (radius) and color of Vega compare with the Sun?
the analysis of light by means of identifying its differing intensity at a range of wavelengths
a spectrum of light composed of radiation of a continuous range of wavelengths or colors, rather than only certain discrete wavelengths
a series or pattern of dark lines superimposed on a continuous spectrum
a stable configuration of electrons inside an atom; the electrons are not changing energy levels so no light is absorbed or emitted
a series or pattern of bright lines superimposed on a continuous spectrum
balance between the weights of various layers, as in a star or Earth’s atmosphere, and the pressures that support them
a compact object of extremely high density composed almost entirely of neutrons
a region in spacetime where gravity is so strong that nothing—not even light—can escape
