1 Week 1 AS IMPORTED

Lab/Week 1
Evolution: Geological Time, Primate and Human Evolution, and Molecular Evolution
Farshad Tamari, Ph.D.
* Figures and text are intended for OER
Objectives:
- Identify major geological and evolutionary events
- Create a scaled timeline of major evolutionary events and indicate the approximate date of each
- Calculate the proportion of earth’s history for which various groups of organisms have existed
- List derived characteristics of primates and humans
- Distinguish between primitive and advanced characteristics in primate facial and skull bones
- Analyze evolutionary relationships using molecular (DNA) evidence
I. Geological and Evolutionary Timeline
A. Geological Evolutionary Timeline
Earth is approximately 4600 million years old (equivalent to 4.6 billion years old). The major events of the evolution of life on earth are summarized in Table 1, and together with the exercise that follows are adopted (with modification), from Barrow 2016. Your instructor might ask you to read the article entitled
Picturing Evolution through Geologic Time
before coming to the lab. Click
here
to view the article entitled
Picturing Evolution through Geologic Time
.
|
Major Event |
Time (million years ago, mya) |
|
Earth forms |
4600 |
|
Prokaryotes |
3400 |
|
O |
2400 |
|
Eukaryotes |
1200 |
|
Animals with shells |
600 |
|
Fish |
520 |
|
Amphibians |
435 |
|
Vascular plants |
425 |
|
Reptiles |
350 |
|
Mammal-like organisms |
275 |
|
Dinosaurs |
245 |
|
Birds |
165 |
|
Flowering plants |
125 |
|
Dinosaur extinction |
65 |
|
Modern mammals |
65 |
|
Modern humans |
0.2 |
|
Present |
0 |
Table 1:
Major events throughout Earth’s history. Prepared by F. Tamari, adopted from Barrow 2016.
Activity 1: Evolutionary Representation of Timeline on Earth
- Using string (thread) and a tape measure or a long ruler (see figure 1), measure a piece of string 4.6 meters long. Lay it flat on the bench. This represents a timeline of the Earth’s 4.6 billion year history.

Figure 1.
Evolutionary timeline of the Earth. ( Credit to Dr. Azure Faucette)
Calculate what each unit of the ruler represents in the number of years. For example:
If 4.6 m = 4.6 billion years, then 1 m = 1 billion years.
1 m = 1 billion years
1 cm = ________ years
1 mm = ________ years
- Using masking tape, place a thin piece of tape on the string at the appropriate distance to indicate each evolutionary event from Table 1 on the string. On the tape indicate the date and the event. Do this until you have marked all the events on the string. Please note that in order to mark the events to scale as required, you will need to use the conversion factors you calculated in the previous step. For example, if you are marking the origin of the prokaryotes to scale, you need to know how far 3400 million years would be from 4600 million years (the beginning of your timeline). You can solve it using algebra, like this:
3400 million
=
X
4600 million 4.6 m
You can solve for X algebraically as follows:
X = (3400 million * 4.6 m) / 4600 million
The units “million” cancel, and your final answer is in meters (m).
This tells you how many meters to measure from 0 (the end of your timeline, or the present day). That is the point where you will place the event “prokaryotes.” Calculate the other events in Table 1 in a similar manner.
Answer the following questions:
- What patterns if any did you notice in the timeline? In other words, what did you notice or what surprised or interested you about the spacing of the events?
- What proportion (in %) of Earth’s life history does each even represent? Complete your work in the table 2 below and show your calculations.
|
Major Event |
Time (mya) |
Calculation (work) |
Proportion (%) |
|
Earth forms |
4600 |
|
|
|
Prokaryotes |
3400 |
e.g. 100%*(3400)/4600= |
~ 74% |
|
O |
2400 |
|
|
|
Eukaryotes |
1200 |
|
|
|
Animals with shells |
600 |
|
|
|
Fish |
520 |
|
|
|
Amphibians |
435 |
|
|
|
Vascular plants |
425 |
|
|
|
Reptiles |
350 |
|
|
|
Mammal-like organisms |
275 |
|
|
|
Dinosaurs |
245 |
|
|
|
Birds |
165 |
|
|
|
Flowering plants |
125 |
|
|
|
Dinosaur extinction |
65 |
|
|
|
Modern mammals |
65 |
|
|
|
Modern humans |
0.2 |
|
|
|
Present |
0 |
|
|
Table 2:
Major events throughout Earth’s history exercise.
II. Primate and Human Derived Characteristics
A. Primate and Human Derived Characteristics
Primates are the group of mammals that include all monkeys and apes. The apes include gorillas, orangutans, chimpanzees, and humans.
Characteristics of both primates and humans can be found in Table 3.
|
Primate Derived Characteristics
|
Human Derived Characteristics |
|
A. Hands and feet for grasping B. Large brain short jaws C. Forward-looking eyes D. Complex social behavior and parental care E. Opposable thumbs (monkeys and apes)
|
A. Upright posture B. Bipedal locomotion (on two legs) C. Large brain D. Language E. Symbolic thought |
Table 3.
Comparison of Primate and Human derived characteristics ( Data by F. Tamari, table by A. Faucette and D. Brogun).
An indication of the larger brain size is evidence found from cranial bones in skull fossils of different taxa. Here are some representatives:
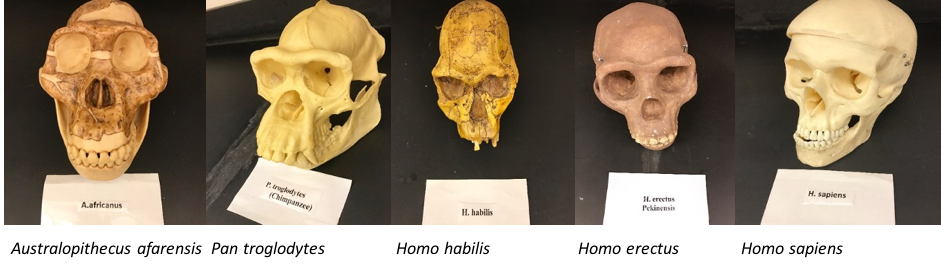
Figure 2:
Cranial and facial bone replicas. Photos by D. Brogun, panel by F. Tamari.
Activity 2: Skull fossil exercise.
Pre-lab: Your instructor might direct you to view this short video before lab.
Watch t
his short video
by:
American Museum of Natural History
(
https://www.youtube.com/watch?v=DZv8VyIQ7YU
).
In the lab
:
1.
It is estimated that the chimpanzees diverged from the lineage that gave rise to the human lineage about 6 mya (including Australopithicenes such as Lucy and later, other Homo species such as
Homo neanderthalensis
, the Neanderthals). Modern humans (
Homo sapiens
) evolved approximately 200,000 years ago (0.2 mya). Examine the replica skulls on the demonstration table closely, which are similar to the ones in Figure 3. View the cranial bones as well as the facial bones. Consider the following attributes:
i. the length of the jaw
ii. the size of the cranium
iii. the morphology of the bridge of the nasal bone
iv. the morphology of the eyebrow ridge
v. teeth number and specialization
What patterns do you notice for i-v from the most primitive to the advanced organism? Use figure 1 which is organized from the most primitive (left) to advanced (right) to help your analysis. Record your observations in the table below.
|
Attribute |
Pattern observed from most primitive to most advanced |
|
Jaw length
|
|
|
Cranium size
|
|
|
Bridge of nose
|
|
|
Eyebrow ridge
|
|
|
Teeth number and specialization |
|
Table 3:
Results of the cranial and facial bone comparison
Answer the following questions:
- What can you conclude from your observation of the size of the cranium?
- What can you conclude about the differences observed in the number and morphology of the teeth?
III. Molecular Evolution
A. The use of molecular data.
Molecular data can be used to delineate relationships among organisms. The more DNA identity (similarity) the more closely two species are (the more recent their ancestry and point of divergence). The more DNA difference (dissimilarity) the more distantly related two organisms are considered to be. It is therefore of value to calculate how similar or dissimilar conserved sequences of DNA are.
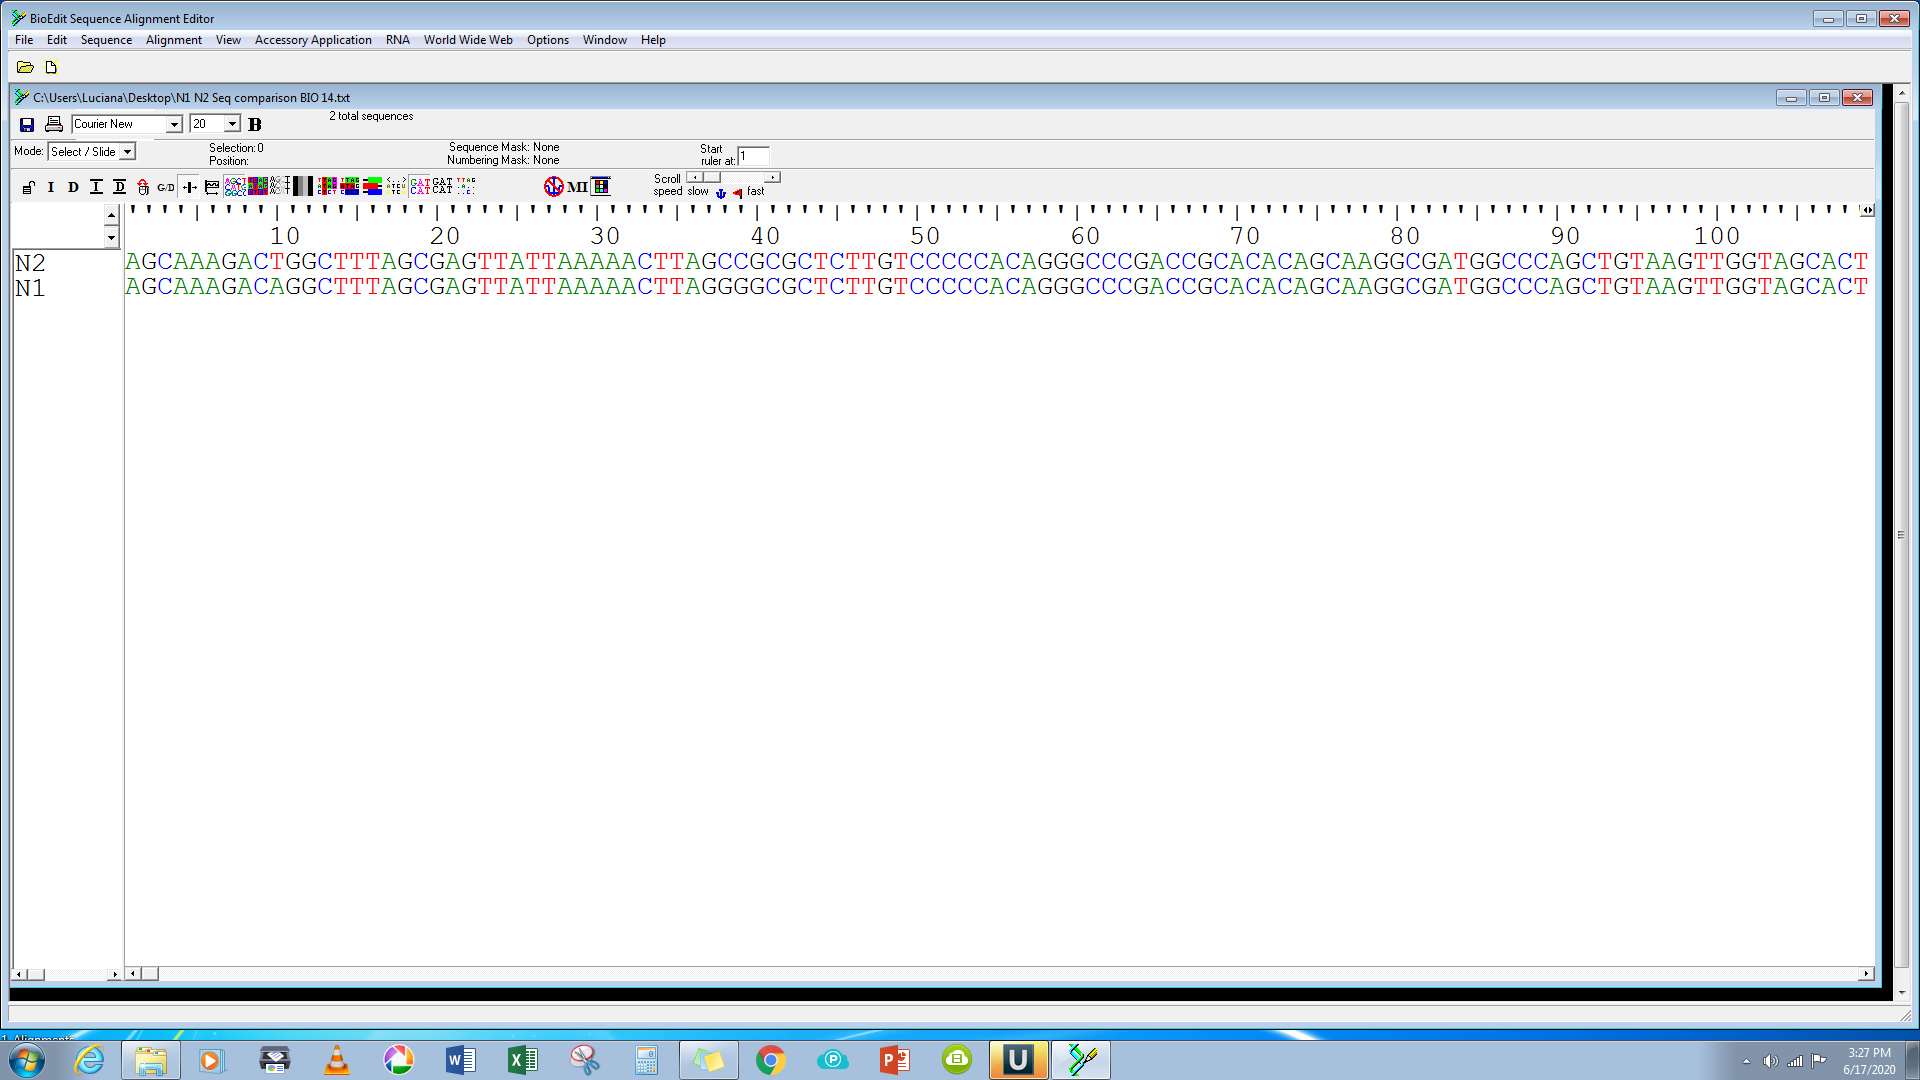
For example, look at the following two sequences (N2 and N1), representing short DNA sequences belonging to two different species. They have been aligned using bioinformatics software. Consider the first 100 nucleotides. How many of the nucleotides are identical between species N2 and N1?
Figure 2:
DNA alignment of two simulated DNA from two hypothetical species, N1 and N2. Alignment and figure by F. Tamari


Using the same software, the differences can be highlighted. Here’s a snapshot of this simple analysis.
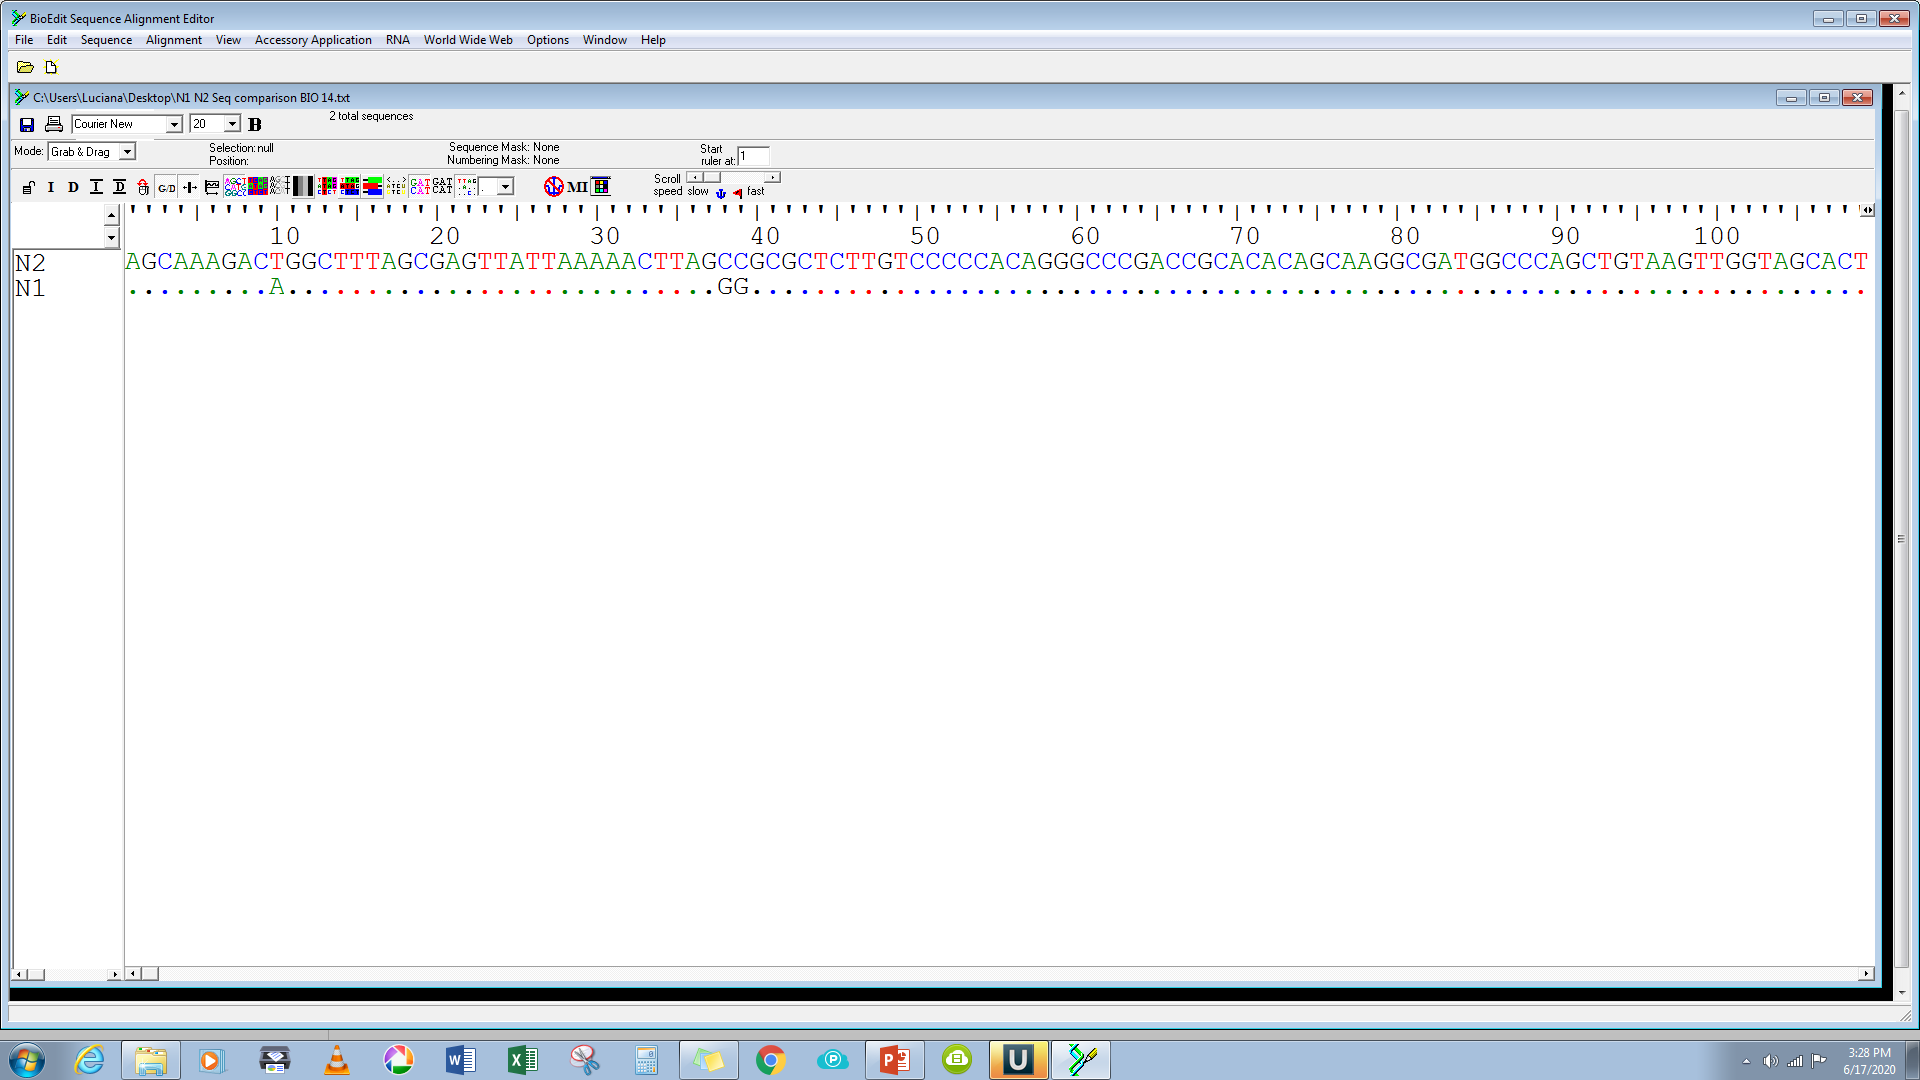
Figure 3:
DNA alignment of two simulated DNA from two hypothetical species, N1 and N2. Alignment and figure by F. Tamari
For the first 100 nucleotides:
% difference = {(100%)* (# changed nucleotides)}/total number of nucleotides considered
=100%*3/100
= 3%
% identity = {(100%)* (# unchanged nucleotides)}/total number of nucleotides considered
=100%*97/100
= 97%
Consider the following alignment for two species, N3 and N4.
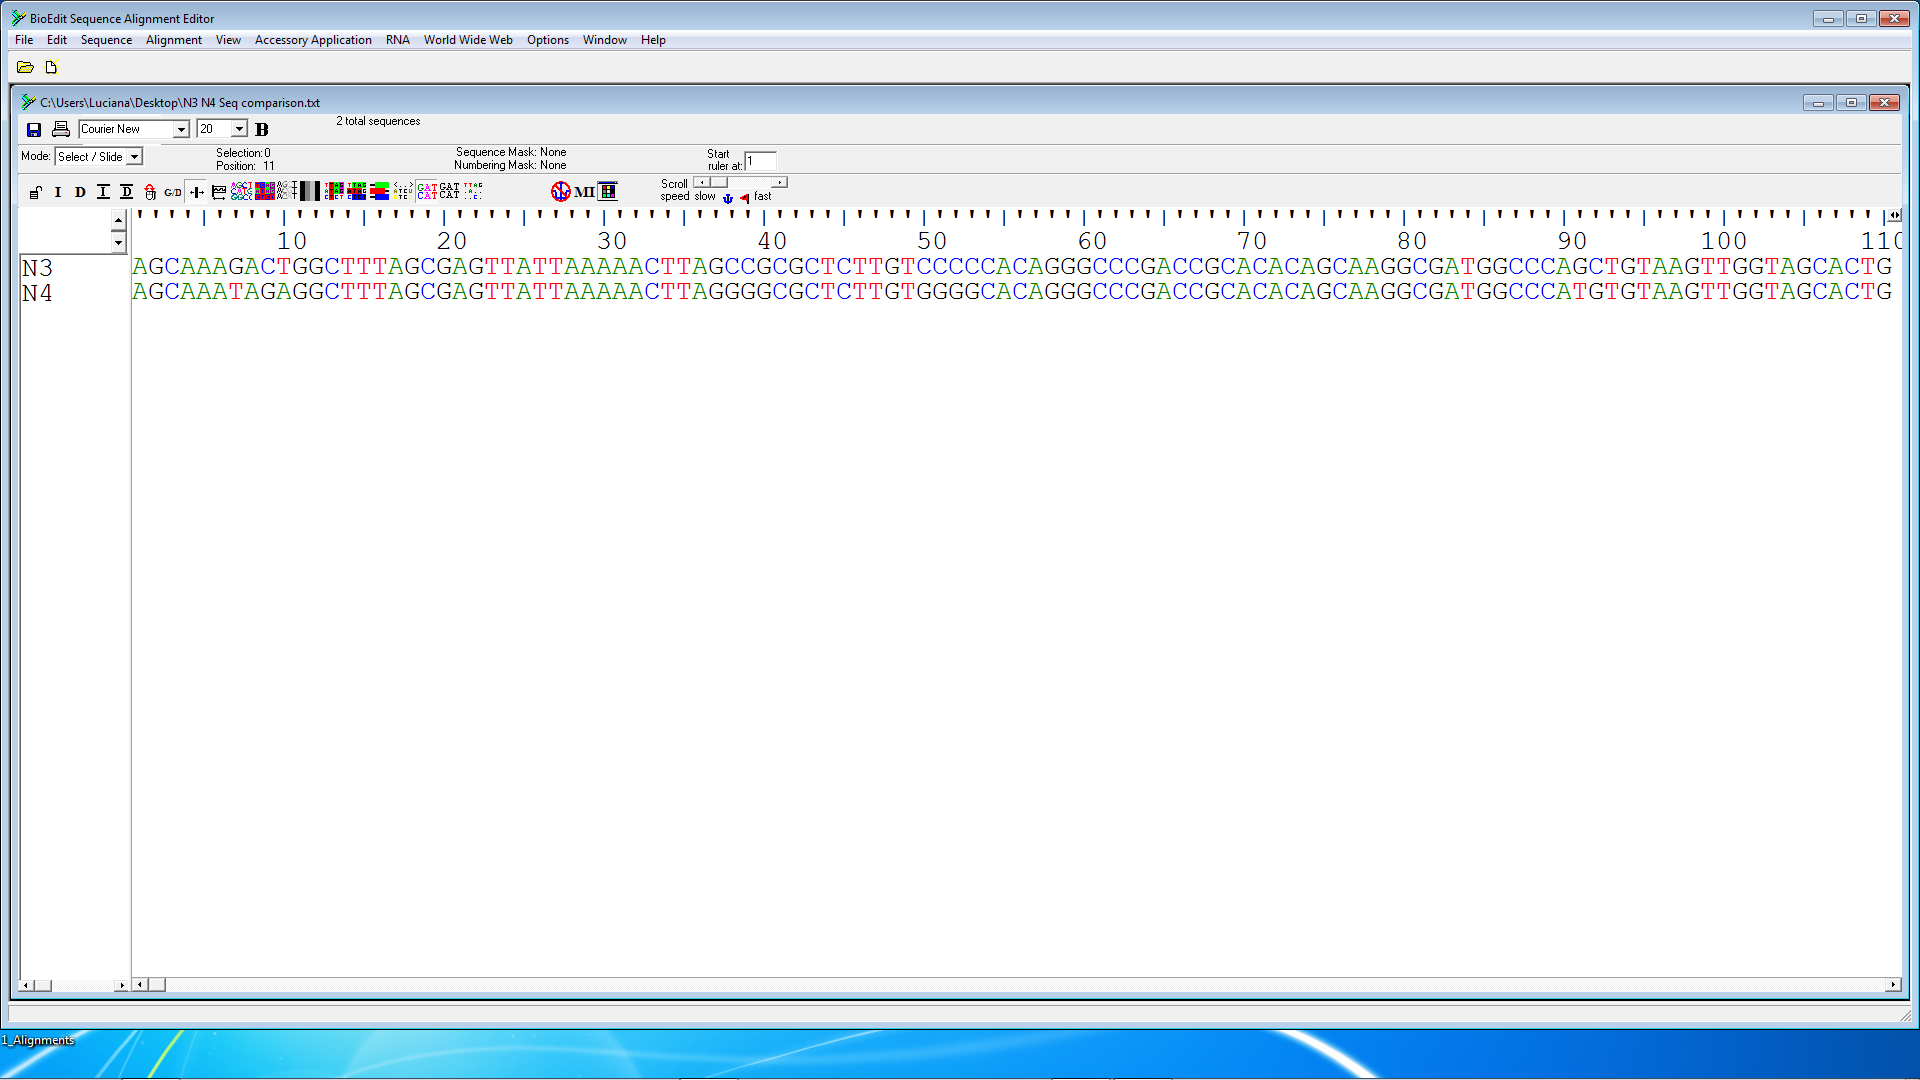
Figure 4:
DNA alignment of two simulated DNA from two hypothetical species, N3 and N4. Alignment and figure by F. Tamari.
Calculate both % difference and % identity. Show all your work.
% difference =
% identity =
Activity 3. Molecular evolution exercise
The following activity was written by Craig Hinkley, Ph.D., and data was gathered from the DNA Learning Center at Cold Spring Harbor.
Procedure:
- Work in groups of four students.
-
Each group has four DNA sequence comparisons to examine. These DNA comparisons are between a modern human and either another modern human, a Neanderthal, a chimpanzee, or a dog. -
In Table 4, record the ID (location name/number) of the specimen of modern human DNA your group is comparing and the ID (location name/number) of the four specimens to which it is being compared. -
Each student in a group should work with one DNA sequence comparison. -
For each comparison, the differences between the two sequences are highlighted. Dashes (-) indicate a mutation that is due to either an insertion or deletion in one of the sequences. - Count the number of differences between your two sequences.
- Count each nucleotide difference as one difference (including single insertions or deletions).
- Count each insertion or deletion containing more than one difference (two or more dashes in a row) as one difference.
- In Table 5, record the total number of DNA nucleotide differences and the total number of DNA nucleotides that were compared.
- Calculate the percentage of DNA nucleotide differences between the sequences and record the percentage difference in Table 5.
- In Table 5, record the data for the other three DNA comparisons from your group.
Results
|
|
ID (location name & number) of your specimen |
|
Modern human DNA of Group _______ |
|
|
Chimpanzee DNA |
|
|
Dog DNA |
|
|
Modern DNA |
|
|
Neanderthal DNA |
|
Table 4.
List of DNA sequences compared.
|
DNA compared to modern human DNA |
Number of nucleotide differences |
Number of nucleotides compared |
Percentage of DNA nucleotide differences |
|
Chimpanzee |
|
|
|
|
Dog |
|
|
|
|
Modern human |
|
|
|
|
Neanderthal |
|
|
|
Table 5.
Comparisons of DNA from modern humans to other vertebrates
Data Analysis
- Examine the data you recorded in Table 5 (In other words, try to look for trends or patterns in your data). Record what you find.
-
Arrange the sequences from the smallest
number
of nucleotide differences to the largest number of differences.
-
Arrange the sequences from the smallest
percentage
of nucleotide differences to the largest percentage of differences.
-
Is there any difference between the order of the sequences you wrote down in #2 and #3 above? If so, why do you think there is a difference?
- Which is better to use for the comparisons, the total number of nucleotide differences or the percentage of nucleotide differences? In 2-3 sentences, explain why you think so.
Conclusion
In 3-4 sentences, write a conclusion that states whether the data supports or does not support your hypothesis. Include at least one piece of data that supports this conclusion.
