III. Molecular Evolution
Molecular data can be used to delineate relationships among organisms. The more DNA identity (similarity), the more closely two species are; that is, the more recent their ancestry and point of divergence. The more DNA difference (dissimilarity), the more distantly related two organisms are considered to be. It is therefore of value to calculate how similar or dissimilar conserved sequences of DNA are.
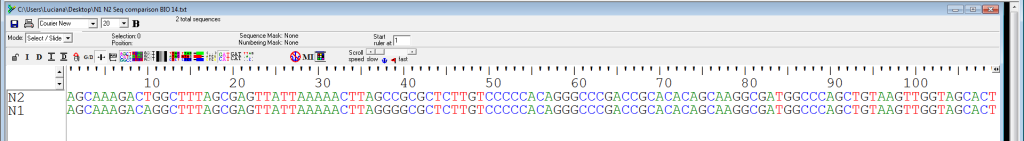
For example, look at the following two sequences (N2 and N1), representing short DNA sequences belonging to two different species (Figure 3). They have been aligned using bioinformatics software. Consider the first 100 nucleotides. How many of the nucleotides are identical between species N2 and N1?
Using the same software, the differences can be highlighted. Here’s a snapshot of this simple analysis (Figure 4).
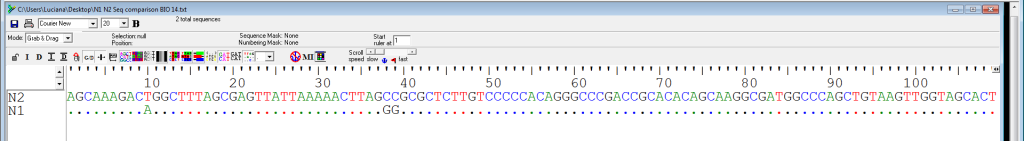
For the first 100 nucleotides:
% difference = {(100%) * (# changed nucleotides)} / total number of nucleotides considered
= 100% * 3 / 100
= 3%
% identity = {(100%) * (# unchanged nucleotides)} / total number of nucleotides considered
= 100% * 97 / 100
= 97%
Consider the following alignment for two other species, N3 and N4 (Figure 5).
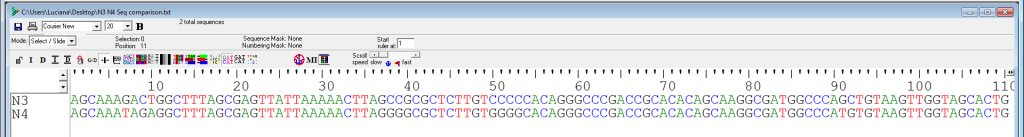
Calculate both % difference and % identity. Show all your work.
% difference =
% identity =
Activity 3: Molecular Evolution Exercise
The following activity was written by Craig Hinkley, Ph.D., and data was gathered from the DNA Learning Center at Cold Spring Harbor.
Procedure
- Work in groups of four students.
- Each group has four DNA sequence comparisons to examine. These DNA comparisons are between a modern human and either another modern human, a Neanderthal, a chimpanzee, or a dog.
- In Table 5, record the ID (location name/number) of the specimen of modern human DNA your group is comparing and the ID (location name/number) of the four specimens to which it is being compared.
- Each student in a group should work with one DNA sequence comparison.
- For each comparison, the differences between the two sequences are highlighted. Dashes (–) indicate a mutation that is due to either an insertion or deletion in one of the sequences.
- Count the number of differences between your two sequences.
- Count each nucleotide difference as one difference (including single insertions or deletions).
- Count each insertion or deletion containing more than one difference (two or more dashes in a row) as one difference.
- In Table 6, record the total number of DNA nucleotide differences and the total number of DNA nucleotides that were compared.
- Calculate the percentage of DNA nucleotide differences between the sequences and record the percentage difference in Table 5.
- In Table 6, record the data for the other three DNA comparisons from your group.
Results
| Species of Specimen | ID (location name and number) of Your Specimen |
| Modern human DNA of Group _____ | |
| Chimpanzee DNA | |
| Dog DNA | |
| Modern DNA | |
| Neanderthal DNA |
| DNA compared to modern human DNA | Number of nucleotide differences | Number of nucleotides compared | Percentage of DNA nucleotide differences |
| Chimpanzee | |||
| Dog | |||
| Modern human | |||
| Neanderthal |
Data Analysis
- Examine the data you recorded in Table 6. In other words, try to look for trends or patterns in your data. Record what you find.
- Arrange the sequences from the smallest number of nucleotide differences to the largest number of differences.
- Arrange the sequences from the smallest percentage of nucleotide differences to the largest percentage of differences.
- Is there any difference between the order of the sequences you wrote down in #2 and #3 above? If so, why do you think there is a difference?
- Which is better to use for the comparisons, the total number of nucleotide differences or the percentage of nucleotide differences? In 2–3 sentences, explain why you think so.
Conclusion
In 3–4 sentences, write a conclusion that states whether the data supports or does not support your hypothesis. Include at least one piece of data that supports this conclusion.
