Ecology, Part 2 (indoor option): Niche, Competition, and Predator-Prey Dynamics
Objectives
- Explore the concept of an ecological niche and the difference between a fundamental niche and a realized niche using an example of two barnacle species competing for the same resource.
- Using the same two competing barnacle species, demonstrate how limiting factors (predation and desiccation tolerance) interact to result in competitive exclusion, resource partitioning, and realized niches.
- Explain the dynamics in population size in a real-life predator-prey relationship.
- Explain the difference between density-dependent and density-independent factors that affect population growth.
- Interpret real-life predator-prey population data as depicted in a graph.
This lab includes two activities through which you will explore the concept of an ecological niche and a predator-prey relationship.
I. Ecological Niche and the Effects of Competition
An important concept in community ecology is the idea of niche. An ecological niche is defined as the total resources that a species requires for its survival. This includes all the ways in which a species interacts with the abiotic and biotic factors in its environment, and is sometimes referred to as its role in the ecosystem in which it lives. Several species in a given ecosystem may compete for the same resources (space, food, etc.), and this interaction may result in either competitive exclusion (the exclusion of one species from the niche) or in resource partitioning (alterations to the niche of each competing species).
Key Terms
| Term | Definition |
| Limiting factors, or environmental resistance | Any factors that limit population growth, such disease, lack of food, water, or space |
| Abiotic factors | Environmental factors that do not result from living things, such as precipitation, wind, temperature, soil type, oxygen saturation, salinity, fire, etc. |
| Biotic factors | Environmental factors that result from living things, such as competition, predation, and symbiosis |
| Ecological niche | The total resources that a species requires for its survival |
| Fundamental niche | The total resources that a species may potentially use, if no competition exists |
| Realized niche | The total resources that a species actually uses when it must compete with other species for the same resources |
| Competitive exclusion | A possible outcome of competition between two species for the same resource, in which one species eventually outcompetes the other, forcing it to migrate or to become extinct |
| Resource partitioning | A possible outcome of competition between two species for the same resource, in which the species narrow or specialize their niche in order to avoid competition |
Activity 1
This online activity allows you to explore the outcome of a real-life competition for space between two species. This well-known example involves barnacles, which are sessile marine arthropods that settle permanently on rocks in the intertidal zone. They must remain attached to the rocks to survive, so there is strong competition for limited space. At the same time, there are two other important limitng factors: desiccation (or drying out) during low tide, and predation (being eaten by a snail predator).
The interactive tool allows you to change the variables in the environment (settling rate of barnacles, tidal level, and number of predators) and then see how those changes affect the competition for space. After trying out the simulation, you will answer the following questions. Remember, for each question you are trying to find out how changing each variable affects the competition for space. So your answers should focus on whether the space occupied by each species is the same or different before and after changing each variable.
- How does changing the tidal level affect the outcome of competition?
- How does changing the number of barnacle larvae affect the outcome of competition? Answer this for each species.
- How does changing the density of predators affect the outcome of competition?
- Does the competition between the barnacles result in competitive exclusion, resource partitioning, or both? Explain your answer and use specific data from the simulation to support your answer.
Read the following tips and then begin “Virtual Biology Lab: Barnacle Competition.”
Tips
- Read the background information first, and review the tutorial carefully before you try the experiment. Otherwise, you’re likely to get pretty confused.
- For the first trial, keep all the variables at the default level (don’t change them yet). For each trial, change only one variable at a time to make it easier to see the effects of each one separately. When you are ready to change the variables, I recommend altering them as follows. This will make it easier to see the effects.
- Tidal change: increase from 3 m to 6 m
- Larvae: increase from 2.5 larvae/ml to 5 larvae/ml
- Thais predators: increase from 3 to 6
- Run each trial at 10x (use the fast forward button to increase the speed)—otherwise it takes too long to get results.
- Run each trial for 15 days (the data counter keeps track of the days for you—watch it and pause when you get to 15).
- Keep track of the results of each trial on a piece of paper. Write down what the picture and the graph tell you at the end of each trial. Use the lab report questions (the four questions above) as a guide for what you need to get from your results.
II. Predator-Prey Dynamics
One very interesting area of ecological research is investigation of the effects that predators and prey have on each other. Predators and prey exert selective pressures on each other, as well as influencing each other’s population size and density. In this activity, we will focus on the effects they have on one another’s population dynamics. There is a document in the link in part C below to guide you through an analysis of actual population data from a study of Arctic foxes and lemmings.
Key Terms
| Term | Definition |
| Predator | An organism (usually an animal) that actively hunts another species, which it consumes |
| Prey | An organism (usually an animal) that is hunted and consumed by another species |
| Predation rate | The proportion of prey consumed by predators per unit time. For example, a rate of 0.02/year means that 2% of the population is consumed each year |
| Logarithmic scale | A way to display the data on the x or y axis that permits one to display data over a very wide range. For example, instead of labeling the axis arithmetically in consistent increments (e.g., 1, 2, 3, 4, 5, etc), the axis may be labeled logarithmically in increments that increase by a standard factor.(e.g., 1, 10, 100, 1000, etc) |
| Nonlinear regression | A statistical method used to create a best-fit curve (in other words, an equation) to represent the relationship between two related variables on a graph. Linear regression also does this, but only works when the two variables have a direct and consistent relationship. Nonlinear regression may be used when the two variables may not be directly related, or when other variables may also affect the relationship. When attempting to fit a curve to your data, a good rule of thumb to decide between linear and nonlinear regression is to try linear first. If you cannot find a curve that fits your data well, you may need to use nonlinear regression. |
Activity 2
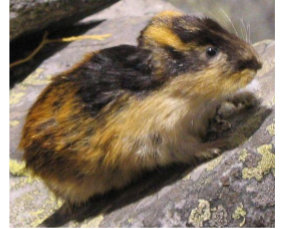
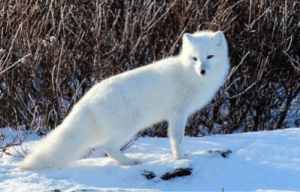
The data in this activity are based on observations of the lemming (prey; Figure 1) and Arctic fox (predator; Figure 2).
This activity is a slightly modified version of one of many educational online activities published by the Howard Hughes Medical Institute. (Click here for the original exercise.) Learning to correctly interpret data and draw conclusions is a central skill in science. Be sure to read the Background Information and Interpreting the Graph sections—many of the answers to the discussion questions are found there.

.jpg)