Week 3, Part 1: Phylogenetics
Objectives
- Explain how the following evidence is used for phylogenetic reconstruction: the fossil record, DNA, and biogeography.
- Describe specific examples of phylogenetic reconstruction, such as the relationship of humans to other primates.
- Build and analyze a phylogenetic tree, identifying patterns of shared ancestry.
- Differentiate between the allopatric and sympatric modes of speciation.
Type your textbox content here.
I. Building the Phylogenetic Tree
Taxonomy is the classification of organisms. Phylogenies represent the foundation of classifying organisms based on their evolutionary relationships. The phylogenetic tree depicted in Figure 1 represents patterns of ancestry—an evolutionary relatedness. In order to reconstruct these relationships, biologists must collect and analyze evidence, which they use to form a hypothesis about how the organisms are related—a phylogeny. In laboratory one, you analyzed fossil records as evidence to support your hypothesis. In this laboratory, you will be analyzing the DNA sequences to reconstruct evolution. Phylogenetic trees that utilize both fossil and molecular evidence are more likely to accurately reflect evolutionary history. Can you explain why both types of evidence are necessary?
To build a phylogenetic tree such as the one in Figure 1, biologists collect data about the characters of each organism they are interested in. (For the moment, don’t worry about trying to read the names of the organisms on each branch.) Characters are heritable traits that can be compared across organisms, such as physical characteristics (morphology), molecular characteristics (DNA, RNA, and proteins), and behavioral traits. Biogeography (the distribution of organisms) can also be used as evidence in reconstructing phylogeny.
Key Terms
| Term | Definition |
| Phylogenetics | Study of evolutionary relationships among individuals or genes |
| Phylogeny | Actual pattern of evolutionary relationships among individuals or genes |
| Taxonomy | Naming and classification of organisms |
| Lineage | Series of organisms, populations, cells, or genes connected by ancestor/descendent relationships |
| Phylogenetic tree | Hypothetical reconstruction of the ancestral evolutionary relationships among individuals or genes via mathematical structure |
| Node | Split point or branch point on the phylogenetic tree |
| Internal node | Branch points representing hypothetical ancestors on the tree |
| Terminal node (aka OTU) |
End points that represent discrete groups or individuals on the tree, grouped by similarity OTU: Operational Taxonomic Unit |
| Branches | Connect nodes on the phylogenetic tree |
| Root | Represents the ancestor of all the individuals or genes in the tree |
| Clade | A group that includes a common ancestor and all the descendants (living and extinct) of that ancestor. A kingdom, a phylum, a family, or a species represent clades at different taxonomic levels. |
| Monophyletic | Group of organisms that includes all the descendants |
| Polyphyletic | Group of organisms that don’t includes all the descendants |
| Allopatric speciation | Reproductive isolation due to the geographical separation of populations |
| Sympatric speciation | Reproductive isolation takes place within the population without the geographical isolation separation |
| Homologous | Shared ancestry in the evolutionary history of life |
| Analogous | Different ancestry in the evolutionary history of life |
Pre-lab Activity: Understanding Phylogenies
In this exercise, you will learn the terminology that phylogeneticists use when constructing or analyzing phylogenetic trees.
First, watch this video.
After viewing the video, study Table 1 below to familiarize yourself with the scientific names of the organisms we will use in our sample tree.
| Genus | Species | Common Name |
| Escherichia | coli | Bacteria |
| Drosophila | melanogaster | Fruit fly |
| Gallus | gallus | Chicken |
| Mus | musculus | Mouse |
| Homo | sapiens | Human |
Next, examine each image below, reading the explanations as you go.
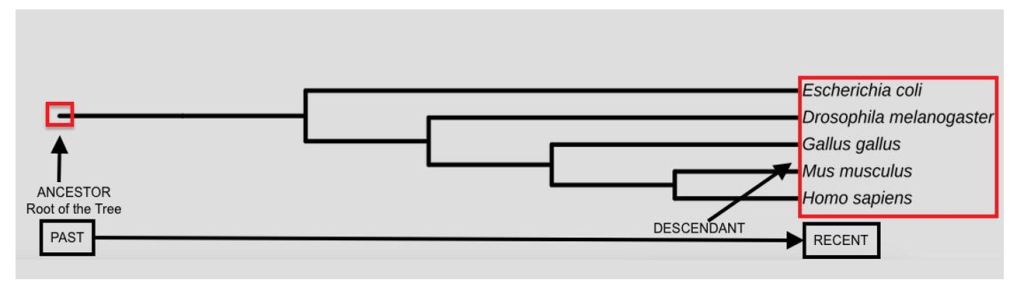
Figure 1 shows you the phylogenetic tree for the organisms in Table 1. Note that the left represents ancestors in the past, with the present-day species represented on the right. The length of each branch is proportional to the amount of time since the origin of each species from its common ancestor with the sister taxon next to it on the tree.
To start, we need to answer the question, what is a phylogenetic tree? First, for the evolutionary biologists, the phylogenetic tree represents a hypothesis that they use to test their predictions while reconstructing ancestral relatedness. Second, it is a geometrical structure that often uses complicated mathematical algorithms to decipher the actual patterns of evolutionary lineages. With that in mind, let’s dive into the phylogenetic tree terminology. Like a living tree, a phylogenetic tree consists of branches that are connected to nodes. The external nodes, also called Operational Taxonomic Units (OTUs), can either represent organisms (as depicted in Figure 1 within the larger red rectangle), or alternatively may represent DNA or protein sequences.
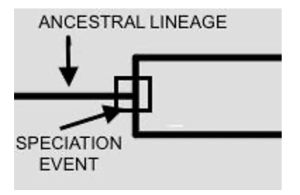
The internal nodes are the branch points that represent ancestral relationships and signify speciation, as depicted in Figure 2 (indicated by the black square). Speciation can give rise to two or more daughter lineages, as discussed below.
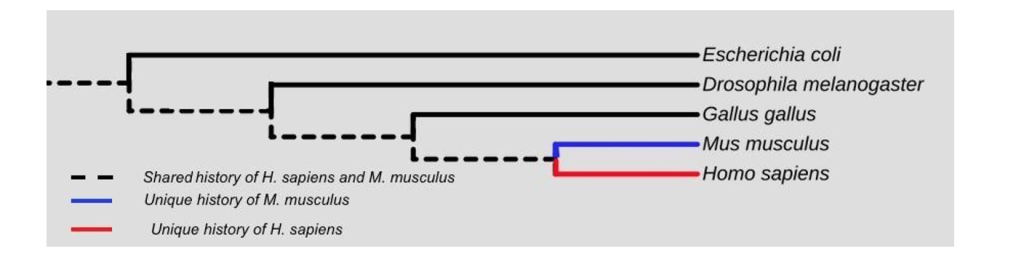
Phylogenetic trees allow researchers to model common and unique evolutionary relationships between lineages, since each lineage has the evolutionary changes that are specific to it alone and parts that are shared with other lineages. For example, consider the dotted line in Figure 3, which represents the common ancestry for mice (Mus musculus) and humans (Homo sapiens). Much of their evolutionary history is the same. However, the blue line represents evolutionary events that occurred after the ancestors of mice and humans diverged, and those events are unique to mice. The same is true of the red line for humans–it represents a unique evolutionary history compared to mice.
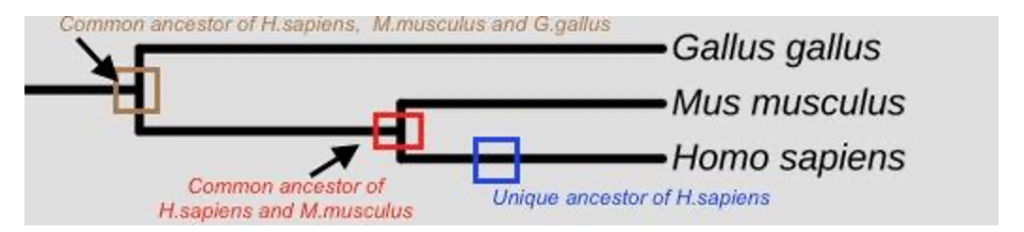
Because they clearly distinguish between shared evolutionary history and unique evolutionary history, phylogenetic trees help us identify common ancestors of two or more groups. For example, in Figure 4 the red square identifies a branch point at which the common ancestor of both mice and humans existed, while the blue square identifies a point in the evolutionary history at which the ancestor of all homo sapiens existed. The brown square, by contrast, represents the common ancestor of mice, humans, and chickens (Gallus gallus) at some point further back in the evolutionary history of all three species.
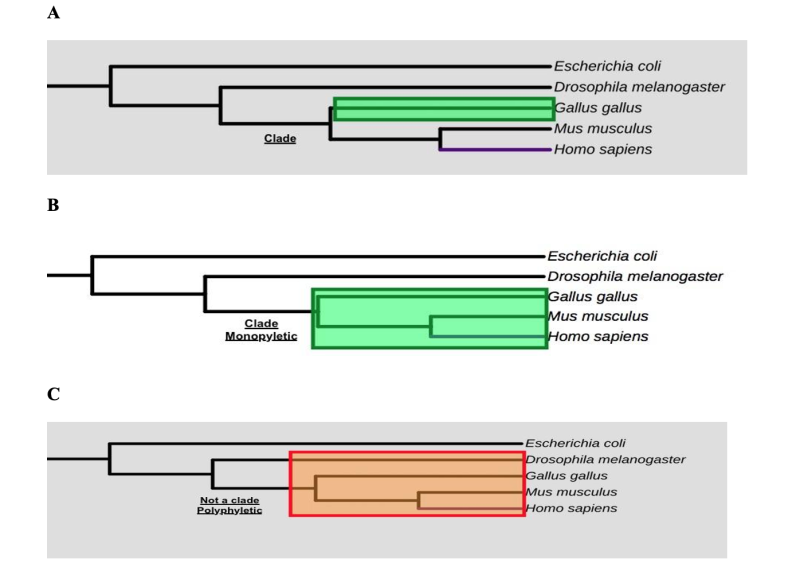
A monophyletic group that includes all the descendants (living and extinct) of a common ancestry forms a clade. It is relatively easy to tell by just looking at the phylogenetic tree whether a monophyletic group of lineages forms a clade. You can ask yourself, what if I remove a single branch of the phylogenetic tree — will all of the organisms on that removed branch make up a clade? Thus, a monophyletic group includes all of the ancestors, whereas a non-monophyletic group, sometimes referred to as polyphyletic, excludes some of them. Hint: follow the green-shaded and red-shaded rectangles in Figure 5 below.
When reconstructing phylogenetic relationships among organisms, it is important to acknowledge that each tree is a hypothesis about how evolution occurred. New data (new fossils, new DNA sequences, or proteins) may result in revisions to a previously constructed tree.
Many of the phylogenies you encounter are groups of closely related species, but we can also use phylogeny to depict the relationships between all life forms.
Finally, there are many ways to depict the phylogenetic tree without changing its meaning. It is important to keep in mind that the tree branches can be rotated, and the choice of which clade goes to the right and which goes to the left does not change the relationships of the terminal nodes. Are the phylogenetic trees in Figure 6 below equivalent?
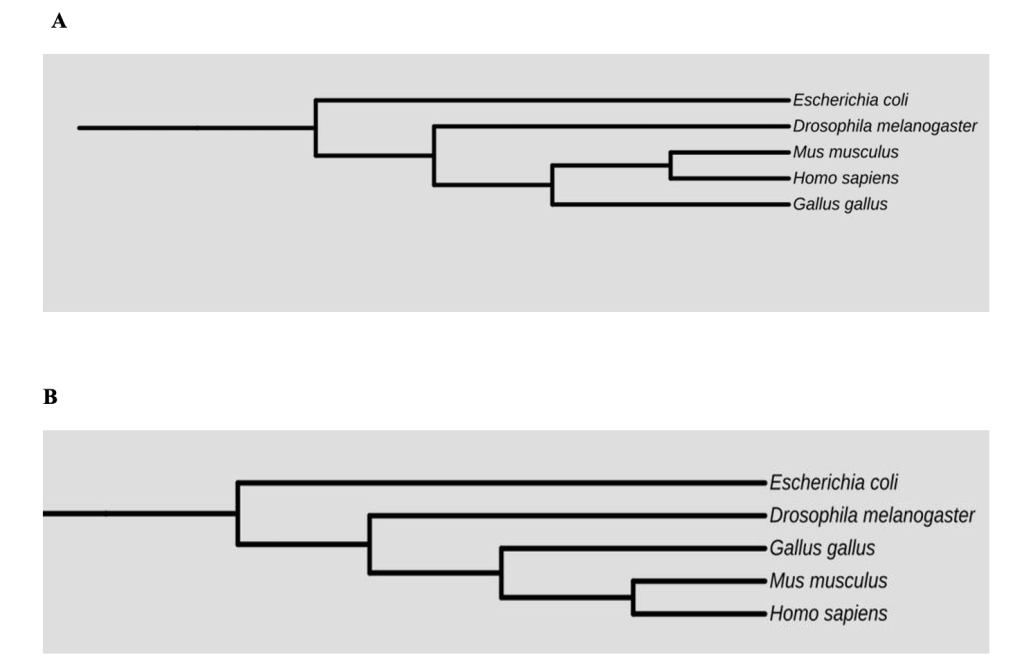
Phylogeneticists often put the clade they are most interested in (whether that is humans, chickens, or bacteria) on the right side of the phylogeny.
You can read more about phylogenetic trees in “Phylogenetic Trees.”
Activity 1: Reconstructing Primate Evolution
Hypothesis: All primates share a common ancestry.
The points described above can cause problems when it comes to human evolution because many of the related primate species are extinct (so-called missing links that make it more difficult to determine who our closest relatives are). The phylogeny of living species most closely related to us looks like this:
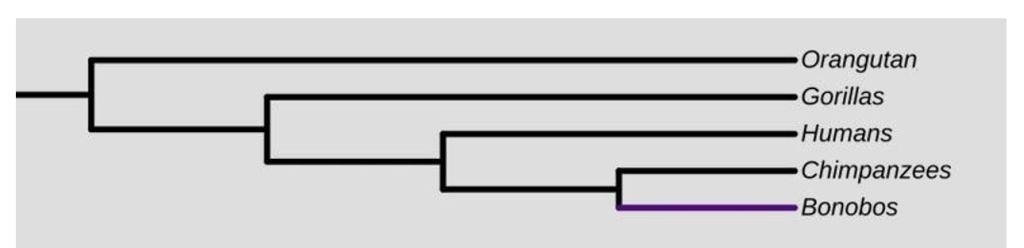
1. In your lab report, identify and label the following parts of the phylogenetic tree depicted above. Hint: check the table of Key Terms if you need help.
a. Root
b. Internal and external nodes
c. OTUs
2. Redraw the tree to show the shared and unique phylogeny of the gorilla lineage. In other words, use a dotted line and a colored line (or two different colors, whatever you like) to indicate the shared lineage of the gorillas versus the unique lineage of the gorillas. See Figure 3 for an example.
3. Do the bonobos, chimpanzees, and humans form a clade? Is it monophyletic? Explain how you know.
Activity 2: Building the Phylogenetic Tree
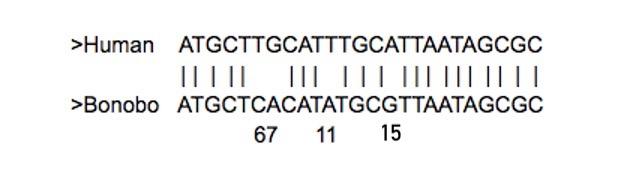
In this exercise, you will practice building your own phylogenetic tree. First, you will manually align DNA sequences from five primates, listed in Table 2. To do this, you will draw vertical lines between matching nucleotides and leave blank spaces between non-matching ones (as shown in Figure 8). Your goal is to construct a phylogenetic tree based on your manual alignments.
You will use the human DNA sequence as your reference sequence during your experiment—meaning that all other sequences will be compared to the human sequence. With the boxed text below, you will find an example of a manual alignment between human and bonobo nucleotide sequences (Figure 8). These sequences are clearly similar yet are not identical. Your task is to identify which regions of the two sequences are homologous.
In the example below the two sequences are different at the sixth, seventh, eleventh, and fifteenth positions. But with only four letters in the nucleotide code, you can imagine that it might be possible to align similar regions of two sequences in more than one way. More issues can arise the less related the two sequences are—if more time has passed since the common ancestor, then more mutations have probably accumulated, including deletions or insertions of larger sections of DNA that will affect alignment. So, we need a way to determine which alignment is the most likely. We do this by calculating the “cost” of a particular alignment. The lower the “cost” of the alignment, the more likely it is that your alignment is correct.
Calculating the cost of the DNA alignment
Using the formula D = s + wg, where D is the cost of alignment, s is the number of substitutions (the number of differences in the two sequences), g is the total length of any gaps, and w is the gap penalty, we can calculate the cost.
Thus, the “cost” of the alignment shown below is D = 4. This number was calculated based on the alignment analysis that there are no gaps, thus g = 0, and the gap penalty w = 1 (this will be a constant in our example since we will not be aligning any sequences with gaps). There are only four nucleotide substitutions, thus s = 4. So, when we plugged the numbers into the formula to calculate the cost of the alignment, D = 4 + 1 * 0, thus D = 4.
You need to repeat these calculations and manual alignments for the remaining primate species listed in Table 2 of this lab.
After you have completed your manual alignments and calculated the costs, you must reconstruct the primate evolution in a phylogenetic tree in your lab report. You will draw your nodes and connect your tree branches and list the OTUs. Please, keep in mind that in your phylogenetic reconstruction the OTUs with the lowest alignment costs will be joined by the adjacent branches, forming a clade, as depicted below in figure 9. Will your phylogenetic tree resemble the phylogeny depicted in figure 7?

Table 2 below summarizes the primate species and the DNA sequences that you will need to analyze during your phylogenetic experiment.
| Species | DNA nucleotides (25 bases long) |
| Human | ATGCTTGCATTTGCATTAATAGCGC |
| Orangutan | TTCCACTCGTGTCTGACAAGATCAC |
| Gorilla | TTGCAGGCGTGTCTCACAACATCCC |
| Chimpanzee | ATGCTCACATATGCGTAAATAGCGC |
| Bonobo | ATGCTCACATATGCGTTAATAGCGC |
It is important to remember that:
- Humans did not evolve from chimpanzees. Humans and chimpanzees are evolutionary cousins and share a recent common ancestor that was neither chimpanzee nor human.
- Humans are not “higher” or “more evolved” than other living lineages. Since our lineages split, humans and chimpanzees have each evolved traits unique to their own lineages.
II. Types of Speciation
Biologists must answer the ultimate question in evolution—how can a continuous process of evolutionary change produce the discrete entities we recognize as different species? Could it be that specific gene changes are involved in reproductive isolation? Below we describe the two possibilities (sometimes called modes) of speciation. The figures below depict two possible scenarios.
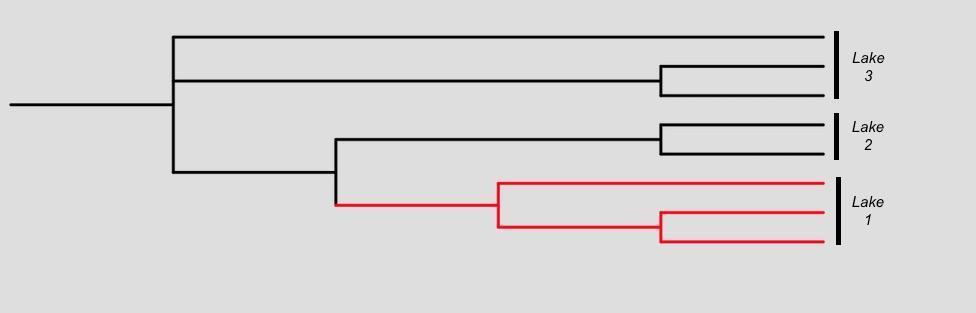
Sympatric speciation: During this type of speciation, reproductive isolation takes place within a single population without geographical isolation. For example, an mtDNA phylogenetic tree of the cichlid fish species in Figure 10A shows that they are monophyletic, suggesting that Lake 1 was colonized by the fish once, thus the speciation occurs without geographic isolation, phylogenetic tree branches depicted in red.
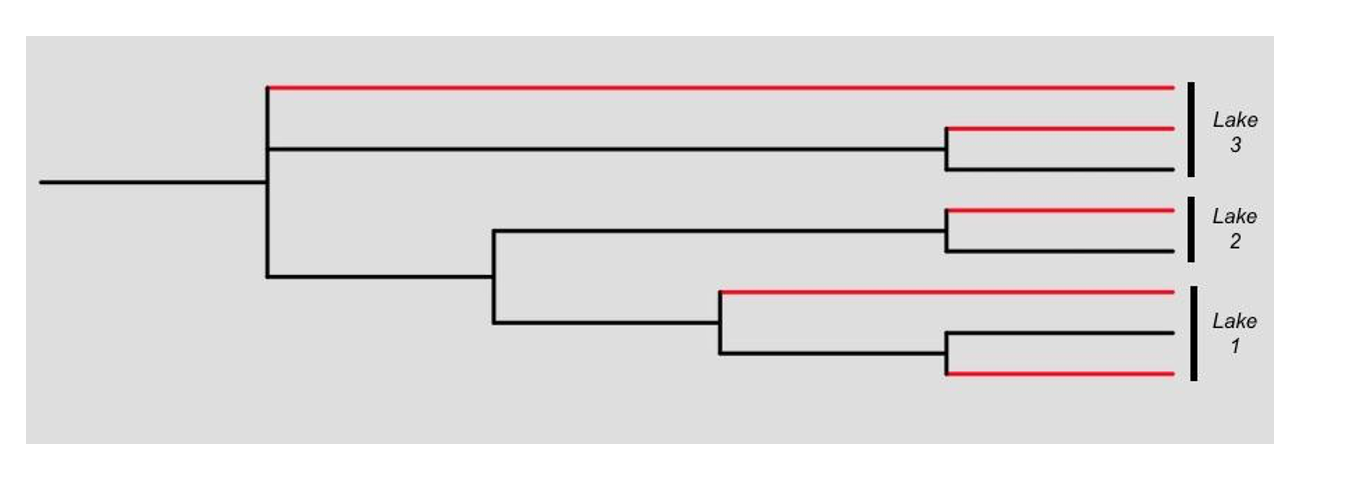
Allopatric speciation: In the allopatric model of speciation depicted in Figure 10B, reproductive isolation is caused by the geographical isolation, thus cichlid species would have entered three lakes on different occasions and so those from each lake would be unrelated on the phylogenetic tree, branches depicted in red.
Activity 3: Questions
Please provide one example for each question below.
1. Biologists must answer the ultimate question in evolution—how a continuous process of evolutionary change can produce the discrete entities we recognize as different species. Explain this in your own words, based on what you have learned so far about the process of evolution.
2. Could it be that specific gene changes are involved in reproductive isolation? If so, how would you test for this?
Works Cited
Avise, JC (1998), The history and purview of phylogeography: a personal reflection. Molecular Ecology, 7: 371-379. https://doi.org/10.1046/j.1365-294x.1998.00391.x
Harvey, Paul H, and Pagel, MD, The Comparative Method in Evolutionary Biology (Oxford, 1991; online edn, Oxford Academic, 31 Oct. 2023), https://doi.org/10.1093/oso/9780198546412.001.0001
Harvey, P. H., Rambaut, A., & Nee, S. (1996). New computer packages for analysing phylogenetic tree structure. Aspects of the Genesis and Maintenance of Biological Diversity, 60-68.
Sarich, VM and Wilson, AC (1967). Rates of albumin evolution in primates. Proceedings of the National Academy of Sciences. 58(1), 142-148. https://doi.org/10.1073/pnas.58.1.142
Schliewen, U. K., Tautz, D., & Pääbo, S. (1994). Sympatric speciation suggested by monophyly of crater lake cichlids. Nature, 368(6472), 629-632. https://doi.org/10.1038/368629a0
