Chapter 7.1: Inflation
7.1 Inflation and the Cost of Living
Learning Objectives
By the end of this section, you will be able to:
- Define inflation
- Explain and use index numbers and base years when simplifying the total quantity spent over a year for products
- Calculate inflation rates using index numbers
- Explain the difference between Consumer Price Index (CPI) and Cost of Living
- How does inflation affect interest rates
Inflation is an overall increase in the price levels of salaries, goods and services. It happens when many prices increase simultaneously. Does inflation pose a challenge? If the cost of my daily coffee rises by 10%, and my salary also increases by 10%, then inflation may not be a concern. As a consumer I am not better off or worst off. The main issue with inflation is that consumers can be worst off due to the fact that salaries do not adjust to accommodate rising prices, leading to individuals who are adversely affected by inflation. It’s crucial to recognize that inflation pertains to an overall increase in the price level, not solely the cost of a specific item.
Dinner table conversations where you might have heard about inflation usually entail reminiscing about when “everything seemed to cost so much less. You used to be able to buy three gallons of gasoline for a dollar and then go see an afternoon movie for another dollar.” Table 7.1 compares some prices of common goods in 1970 and 2021. Of course, the average prices in this table may not reflect the prices where you live. The cost of living in New York City is much higher than in Houston, Texas, for example. In addition, certain products have evolved over recent decades. A new car in 2021, loaded with antipollution equipment, safety gear, computerized engine controls, and many other technological advances, is a more advanced machine (and more fuel efficient) than your typical 1970s car. However, put details like these to one side for the moment, and look at the overall pattern. The primary reason behind the price rises in Table 7.1—and all the price increases for the other products in the economy—is not specific to the market for housing or cars or gasoline or movie tickets. Instead, it is part of a general rise in the level of all prices. At the beginning of 2021, $1 had about the same purchasing power in overall terms of goods and services as 15 cents did in 1972, because of the amount of inflation that has occurred over that time period.
|
Items |
1970 |
2021 |
|
Pound of ground beef |
$0.66 |
$5.96 |
|
Pound of butter |
$0.87 |
$3.50 |
|
Movie ticket |
$1.55 |
$13.70 |
|
Sales price of new home (median) |
$22,000 |
$408,800 |
|
New car |
$3,000 |
$42,000 |
|
Gallon of gasoline |
$0.36 |
$3.32 |
|
Average hourly wage for a manufacturing worker |
$3.23 |
$30.11 |
|
Per capita GDP |
$5,069 |
$63,543 |
“Price Comparisons, 1970 and 2021” by OpenStax, is licensed under CC BY 4.0
Table 7.1 Price Comparisons, 1970 and 2021 (Sources: See chapter References at end of book.)
Moreover, the power of inflation does not affect just goods and services, but wages and income levels, too. The second-to-last row of Table 7.1 shows that the average hourly wage for a manufacturing worker increased nearly ten-fold from 1970 to 2021. The average worker in 2021 is better educated and more productive than the average worker in 1970—but not six times more productive. Per capita GDP increased substantially from 1970 to 2021, but is the average person in the U.S. economy really more than twelve times better off in just 51 years? Not likely.
A modern economy has millions of goods and services whose prices are continually quivering in the breezes of supply and demand. How can all of these shifts in price attribute to a single inflation rate? As with many problems in economic measurement, the conceptual answer is reasonably straightforward: Economists combine prices of a variety of goods and services into a single price level. The inflation rate is simply the percentage change in the price level. Applying the concept, however, involves some practical difficulties.
How to Measure Inflation
The most commonly way to measure of inflation in the United States is the Consumer Price Index (CPI), released by the U.S. Bureau of Labor Statistics (BLS) monthly. The BLS calculates the CPI based on the prices in a fixed basket of goods and services that represents the purchases of the average family of four.
How is the CPI calculated?
To calculate the price level, economists begin with the concept of a basket of goods and services, consisting of the different products that households typically buy. The next step is to look at how the prices of those items change over time.
The BLS uses data on the prices of thousands of goods and services.
Example: Basket of Goods 4 ice-cream cones and 2 cans of soda.
| Year | Price of Ice Cream | Price of Soda | Cost of the basket per year | CPI (2021 base year) | Inflation Rate |
| 2021 | $5 | $2 | $24 | 100 | |
| 2022 | $6 | $3 | $30 | 125 | 25.0% |
| 2023 | $7 | $4 | $36 | 150 | 20.0% |
Table 7.2 Example how to calculate the CPI.
CPI= cost of basket current year/cost of basket base year x 100;
Inflation Rate = ((index year 2/index year 1) – 1 )x 100
The 8 major categories of the consumer price index
- Food and beverages (breakfast cereal, milk, coffee, chicken, wine, full-service meals, and snacks)
- Housing (renter’s cost of housing, homeowner’s cost of housing, fuel and oil, bedroom cost of furniture)
- Apparel (men’s shirts and sweaters, women’s dresses, jewelry)
- Transportation (new vehicles, airline fares, gasoline, motor vehicle automobile insurance)
- Medical care (prescription drugs and medical supplies, physicians’ services, eyeglasses and eye care, hospital services)
- Recreation (televisions, cable television, pets and pet products, sports equipment, entertainment event admissions)
- Education and communication (college tuition, postage, telephone services, computer software and accessories)
- Other goods and services (tobacco and smoking products, haircuts and other personal services, funeral expenses)
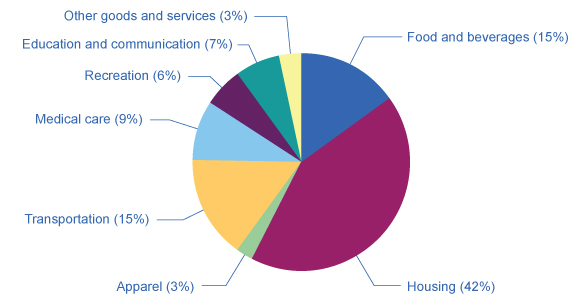
“The Weighting of CPI Components” by OpenStax, is licensed under CC BY 4.0
Figure 7.1 The Weighting of CPI Components Of the eight categories used to generate the Consumer Price Index, housing is the highest at 42.4%. The next highest category, food and beverage at 15.1%, is less than half the size of housing. Other goods and services, and apparel, are the lowest at 3.2% and 2.7%, respectively. (Source: www.bls.gov/cpi)
Does the CPI measure the cost of living?
In recent years, the statisticians have paid considerable attention to a subtle problem: that the CPI that measures change in the total cost of buying a fixed basket of goods and services over time is conceptually not quite the same as the change in the cost of living. The cost of living, for one, includes a broader range of expenses beyond those included in the CPI basket. It includes all expenses necessary for individuals or households to maintain a certain standard of living.
3 Problems Measuring Cost of Living
- Substitution bias: when the price of a product increases, consumers buy less of that product and buy more of an easily replaceable item that is cheaper. If the CPI is computed using a fixed base every year it ignores the possibility of consumer substituting, therefore overstating the cost of living.
- Introduction of new goods: When a new good is introduced to the market, variety increases, the consumer is better off. However, it takes a while for the BLS to add new goods to the CPI basket. The increase of additional options makes the dollar more valuable. The evolution of the economy overtime – as more goods are introduced, consumers have more choices, and the CPI basket takes a while to adjust new products.
- Unmeasured quality change: When the quality of a product increases and the price remain the same, consumers are better off, and opposite will occur when the quality deteriorates, and prices remain unchanged.
Practical Solutions for the Substitution and the Quality/New Goods Biases
By the early 2000s, the Bureau of Labor Statistics was using alternative mathematical methods for calculating the Consumer Price Index, more complicated than just adding up the cost of a fixed basket of goods, to allow for some substitution between goods. It was also updating the basket of goods behind the CPI more frequently, so that it could include new and improved goods more rapidly. For certain products, the BLS was carrying out studies to try to measure the quality improvement. For example, with computers, an economic study can try to adjust for changes in speed, memory, screen size, and other product characteristics, and then calculate the change in price after accounting for these product changes. However, these adjustments are inevitably imperfect, and exactly how to make these adjustments is often a source of controversy among professional economists.
By the early 2000s, the substitution bias and quality/new goods bias had been somewhat reduced, so that since then the rise in the CPI probably overstates the true rise in inflation by only about 0.5% per year. Over one or a few years, this is not much. Over a period of a decade or two, even half of a percent per year compounds to a more significant amount. In addition, the CPI tracks prices from physical locations, and not at online sites like Amazon, where prices can be lower.
When measuring inflation (and other economic statistics, too), a tradeoff arises between simplicity and interpretation. If we calculate the inflation rate with a basket of goods that is fixed and unchanging, then the calculation of an inflation rate is straightforward, but the problems of substitution bias and quality/new goods bias will arise. However, when the basket of goods is allowed to shift and evolve to reflect substitution toward lower relative prices, quality improvements, and new goods, the technical details of calculating the inflation rate grow more complex.
Additional Price Indices: GDP Deflator
Recall from Unit 6 The GDP deflator is a measure used to adjust the gross domestic product (GDP) for inflation or deflation. It is also an index that measures price change, in other words inflation.
Difference between GDP deflator and CPI
The main difference between GDP deflator and CPI is the difference between production and consumption. While the GDP deflator reflects the prices of all goods and services produced domestically, whereas the CPI reflect the prices of goods and services bought by consumers, which naturally includes imported goods as well. In addition, not everything produced is bought by consumers and included in the CPI basket. Suppose that the price of an airplane that Boing produced and sold in a certain year rose. This increase will be reflected in the GDP deflator BUT not in the CPI, in the consumer basket. Another example that is quite relevant is regarding change in oil prices. The US produce oil however, is also, a large importer of oil. When oil prices rise, in the price of heating a house rises, this change is reflected in the CPI and less so in the GDP.
Another difference is that the BLS only occasionally changes the goods and services inside the basket of CPI. By contrast the GDP deflator reflects changes in prices in current GDP, currently produced goods and services. Therefore, the group of goods and services changes automatically in the GDP deflator every year. If all prices in the economy are changing proportionally, this might not be an issue. But if some items with heavier weight for example an aircraft, the price does not change, than this will cause a difference between the measurement of CPI changes and GDP deflator.
How does inflation affect interest rates?
Inflation is a crucial factor in determining interest rates because it affects the real return on investments and borrowing.
Sally deposits $1,000 to the bank (saving accounts) and get 10% return. After one year Sally has $1,100. Is Sally richer? Can she buy more things with that extra $100? The answer is: it depends on the inflation rate.
Nominal Interest Rates vs. Real Interest Rates:
Nominal interest rates represent the stated rate of return on an investment or the cost of borrowing money.
Real interest rates, on the other hand, adjust for inflation to reflect the actual purchasing power gained or lost on an investment or loan.
Real Interest Rate = Nominal Interest Rate – Rate of Inflation
Using the example above, if inflation was more than 10%, then Sally is worse off.
Real Interest rate = 10% – 15%
Real Interest rate = -5%
Inflation can erode the purchasing power of money over time, so investors and lenders demand compensation for this loss in purchasing power.
This majority of this chapter’s content was written by Karen David and published under a Creative Commons Attribution 4.0 International License. This chapter also contains content, graphs and tables from chapter 9.1 Tracking Inflation and chapter 9.2 How to Measure Changes in the Cost of Living in Principles of Macroeconomics 3e by OpenStax, published under a Creative Commons Attribution 4.0 International License.
