Chapter 8.2: Government Spending
8.2 Government Spending- a deeper look
Learning Objectives
By the end of this section, you will be able to:
- Identify U.S. budget deficit and surplus trends over the past five decades
- Explain the differences between the U.S. federal budget, and state and local budgets
This section presents an overview of government spending in the United States.
Total U.S. Government Spending
Federal spending in nominal dollars (that is, dollars not adjusted for inflation) has grown by 38 times over the last four decades, from $93.4 billion in 1960 to $6.8 trillion in 2020. Comparing spending over time in nominal dollars is misleading because it does not take into account inflation or growth in population and the real economy. A more useful method of comparison is to examine government spending as a percent of Gross Domestic Product (GDP) over time.
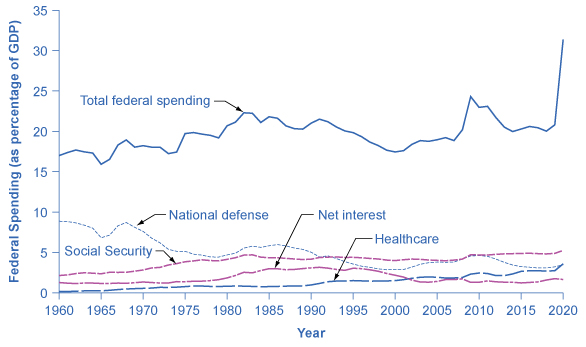
The top line in Figure 8.1 shows the federal spending level since 1960, expressed as a share of GDP. Despite a widespread sense among many Americans that the federal government has been growing steadily larger, the graph shows that federal spending has hovered in a range from 18% to 22% of GDP most of the time since 1960. For example, throughout the latter part of the 2010s, government expenditures were around 20% of GDP. The other lines in Figure 8.1 show the major federal spending categories: national defense, Social Security, health programs, and interest payments. From the graph, we see that national defense spending as a share of GDP has generally declined since the 1960s, although there were some upward bumps in the 1980s buildup under President Ronald Reagan and in the aftermath of the terrorist attacks on September 11, 2001. In contrast, Social Security and healthcare have grown steadily as a percent of GDP. Healthcare expenditures include both payments for senior citizens (Medicare), and payments for low-income Americans (Medicaid). State governments also partially fund Medicaid. Interest payments are the final main category of government spending in Figure 8.1.
“Federal Spending, 1960–2020” by OpenStax, is licensed under CC BY 4.0
Figure 8.1 Federal Spending, 1960–2020 Since 1960, total federal spending has ranged from about 18% to 22% of GDP. It climbed above that level in 2009, quickly dropped back down to that level by 2013, and again climbed above that level in 2020. The share that the government has spent on national defense has generally declined, while the share it has spent on Social Security and on healthcare expenses (mainly Medicare and Medicaid) has increased. (Source: Economic Report of the President, 2021, Table B47, https://www.govinfo.gov/app/collection/erp/2021)
Each year, the government borrows funds from U.S. citizens and foreigners to cover its budget deficits. It does this by selling securities (Treasury bonds, notes, and bills)—in essence borrowing from the public and promising to repay with interest in the future. From 1961 to 1997, the U.S. government has run budget deficits, and thus borrowed funds, in almost every year. It had budget surpluses from 1998 to 2001, and then returned to deficits.
The interest payments on past federal government borrowing were typically 1–2% of GDP in the 1960s and 1970s but then climbed above 3% of GDP in the 1980s and stayed there until the late 1990s. The government was able to repay some of its past borrowing by running surpluses from 1998 to 2001 and, with help from low interest rates, the interest payments on past federal government borrowing had fallen back to 1.6% of GDP by 2020.
We investigate the government borrowing and debt patterns in more detail later in this chapter, but first we need to clarify the difference between the deficit and the debt. The deficit is not the debt. The difference between the deficit and the debt lies in the time frame. The government deficit (or surplus) refers to what happens with the federal government budget each year. The government debt is accumulated over time. It is the sum of all past deficits and surpluses. If you borrow $10,000 per year for each of the four years of college, you might say that your annual deficit was $10,000, but your accumulated debt over the four years is $40,000.
Federal Spending by Categories
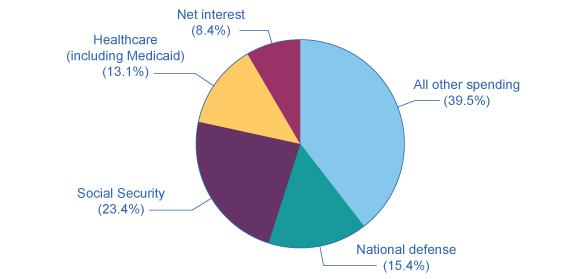
These four categories—national defense, Social Security, healthcare, and interest payments—generally account for roughly 60% of all federal spending, as Figure 8.2 shows. (Due to the large amount of one-time expenditures by the federal government in 2020 due to the pandemic, the 2019 statistics are presented here.) The remaining 40% wedge of the pie chart covers all other categories of federal government spending: international affairs; science and technology; natural resources and the environment; transportation; housing; education; income support for people in poverty; community and regional development; law enforcement and the judicial system; and the administrative costs of running the government.
“Slices of Federal Spending, 2019” by OpenStax, is licensed under CC BY 4.0
Figure 8.2 Slices of Federal Spending, 2019 About 60% of government spending goes to four major areas: national defense, Social Security, healthcare, and interest payments on past borrowing. This leaves about 40% of federal spending for all other functions of the U.S. government. (Source: https://www.whitehouse.gov/omb/budget/Historicals/)
State and Local Government Spending
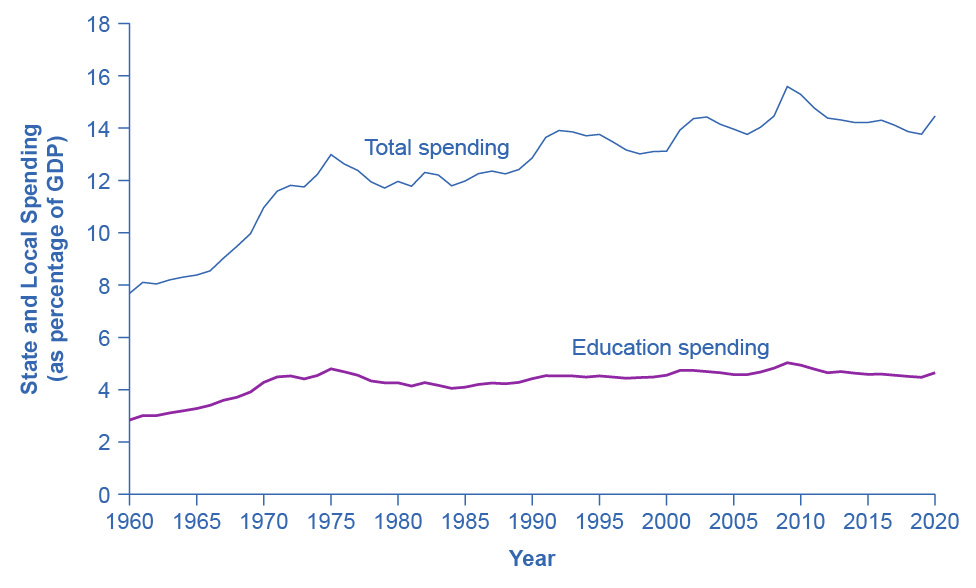
Although federal government spending often gets most of the media attention, state and local government spending is also substantial—at about $3.3 trillion in 2021. Figure 8.3 shows that state and local government spending has increased during the last four decades from around 8% to around 14% today. The single biggest item is education, which accounts for about one-third of the total. The rest covers programs like highways, libraries, hospitals and healthcare, parks, and police and fire protection. Unlike the federal government, all states (except Vermont) have balanced budget laws, which means any gaps between revenues and spending must be closed by higher taxes, lower spending, drawing down their previous savings, or some combination of all of these.
“State and Local Spending, 1960–2020” by OpenStax, is licensed under CC BY 4.0
Figure 8.3 State and Local Spending, 1960–2020 Spending by state and local government increased from about 10% of GDP in the early 1960s to 14–16% by the mid-1970s. It has remained at roughly that level since. The single biggest spending item is education, including both K–12 spending and support for public colleges and universities, which has been about 4–5% of GDP in recent decades. Source: (Source: Bureau of Economic Analysis, https://apps.bea.gov/iTable/index_nipa.cfm.)
U.S. presidential candidates often run for office pledging to improve the public schools or to get tough on crime. However, in the U.S. government system, these tasks are primarily state and local government responsibilities. In fiscal year 2020 state and local governments spent about $970 billion per year on education (including K–12 and college and university education), compared to only $100 billion by the federal government. In other words, about 90 cents of every dollar spent on education happens at the state and local level. A politician who really wants hands-on responsibility for reforming education or reducing crime might do better to run for mayor of a large city or for state governor rather than for president of the United States.
Taxes are paid by most, but not all, people who work. Even if you are part of the so-called “1099” or “gig” economy, you are considered an independent contractor and must pay taxes on the income you earn in those occupations. Taxes are also paid by consumers whenever they purchase goods and services. Taxes are used for all sorts of spending—from roads, to bridges, to schools (K–12 and public higher education), to police and other public safety functions. Taxes fund vital public services that support our communities.
This chapter is a revised version of the chapters 17.1 Government Spending in Principles of Macroeconomics 3e by OpenStax, published under a Creative Commons Attribution 4.0 International License. Modifications have been made in accord with the style, structure, and audience of this guide.
