Chapter 8: Circadian Rhythms and Sleep
8.2: Phases of sleep
Each night when we go to sleep, our brains undergo a very stereotyped pattern of activity changes. At times, neurons in the cortex exhibit synchronized patterns of firing. And at other times, cortical activity looks very similar to an awake brain.
We can divide sleep roughly into two different phases depending on one of the first physiological measures that sleep scientists studied: eye movement. A study published in 1953 used a device to detect eye movement while a person was asleep. Interestingly, they noticed that at some points in the night, usually first occurring around three hours after falling asleep, the patient’s eyes would dart rapidly and jerkily back and forth, a pattern of activity that the University of Chicago researchers called rapid eye movement (REM). This first period of REM activity lasted for about 20 minutes, after which the eyes would stop moving again. This activity pattern repeated every hour or two for the rest of the night. They used eye movement to separate sleep into two phases: REM sleep, and non- REM sleep (NREM sleep.) In addition to eye movement, they observed and measured other physiological behaviors. Respiration rate and heart rate both increased during the REM phase of sleep and dipped during NREM sleep. They also (rudely) woke up patients throughout the two phases of sleep, and found that patients were more likely to recall dreams with visual imagery if their REM sleep was interrupted. Those woken during NREM sleep were less likely to recall dreams, hinting that dreaming is more likely to happen during REM sleep.
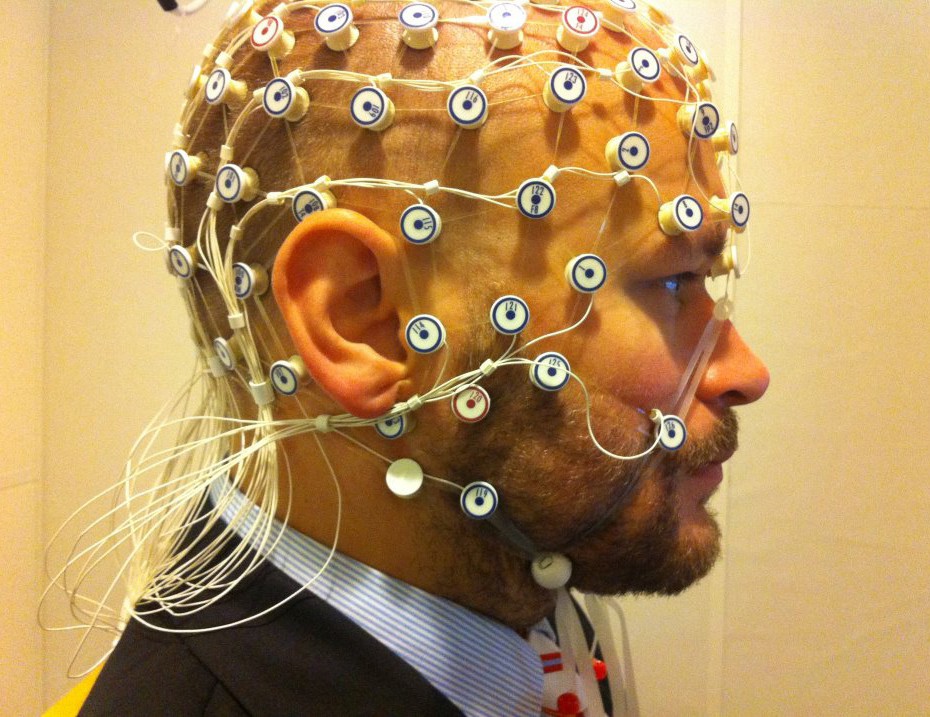
While eye movement could differentiate between two phases of sleep, another common diagnostic technique, electroencephalography (EEG – see Figure 8.2), could further subdivide NREM sleep. EEG measures electrical activity at the scalp, detecting the firing of large numbers of cortical neurons. Using EEG, scientists discovered three distinct NREM phases based on neuron activity patterns: NREM1, NREM2, and NREM3 sleep (see Figure 8.3). Currently, readings collected via EEG are considered to be the gold standard for measuring the stages of sleep.


But before we describe EEG traces while asleep, we should describe the EEG of a person who is awake. Usually, the awake EEG is dominated by high-frequency waves, falling in the beta band range of frequencies: between 13 and 30 Hz. The proportion of neurons firing at the beta frequency increases with attention and mental activity: When a person is concentrating on a task, such as reading a textbook, the beta wave frequency dominates.
NREM1 is the earliest stage of sleep. It’s also described as relaxed wakefulness, drowsiness, or light sleep. During NREM1, a person’s muscles are still somewhat active, their eyelids may open and close every so often, and they may still respond to questions. In NREM1 sleep, the beta frequency amplitude decrease as the slower frequency alpha waves (8-13 Hz) increase in amplitude. Late in NREM1, theta waves (4-8 Hz) become more prevalent. Basically, the deeper into NREM1 sleep a person becomes, more waves with lower and lower frequencies start to emerge.
During NREM2 sleep, theta waves predominate. In a healthy adult, about 50% of a night’s sleep is spent in NREM2. NREM2 is characterized by the appearance of two patterns of activity that interrupt theta activity. K-complexes are large amplitude events that are observed about every minute. These are the largest amplitude events in a healthy human EEG. Following a K-complex you may see a sleep spindle, a high-frequency burst of rapid neural activity in the low beta range that lasts for about a second. It is unknown exactly what the function of these sleep spindles are, but some research suggests they may be involved in memory processes or to minimize perception of outside noises, which can help a person stay asleep even in the face of disruptive stimuli.
NREM3 is also called deep sleep. At this phase of the night, a person’s physiological activity drops to its lowest point of the night: heart rate, respiration, blood pressure, and metabolism all reach minimum during NREM3. In this stage of sleep, many of the cortical neurons fire in synchronicity with one another, and the subsequent change in potentials cause large amplitude deflections in the EEG, at the low- frequency delta band (1 – 4Hz). Because the delta frequency is much slower than frequencies detected in lighter stages of sleep or wake, NREM 3 is also called slow wave sleep.
The EEG trace of a person in REM sleep is quite the opposite of what is seen in deep sleep. Instead of large amplitude events at a low frequency, the REM brain has a lot of low amplitude events at a high frequency. In fact, the brain in REM sleep has a pattern of activity that is more similar to a person who is awake than asleep! Because of this asynchronous firing activity, REM sleep is sometimes also called paradoxical sleep.
To illustrate the stages of sleep that a person experiences each night, we can use a hypnogram (see Figure 8.4). These charts to plot time on the x-axis, and stage of sleep on the y-axis. Awake is represented at the top, and deep sleep is at the bottom. For an average night’s rest, neural activity will fluctuate through the four phases relatively predictably. When a person first falls asleep, they will move from NREM1 down through NREM2 then NREM3, before coming back out of deep sleep progressively back to NREM1. After NREM1, they may enter REM sleep before transitioning back through the stages to NREM3 again. This cycle of activity repeats roughly every one and a half hours.
People spend a larger percentage of each cycle in deep sleep and very little time in REM sleep early in the night. On the other hand, in the last few cycles before waking up from a full night’s rest, people spend a larger percentage of of each cycle in REM sleep, and almost no time in deep sleep.

