Chapter 8. Culture and Vision
8.2. Visual Attention and Culture
A landmark study by Nisbett and Masuda (2003) compared American and Japanese students’ perception of what they saw when they looked at a 20 second video of an underwater scene. American participants typically started by describing large, brightly colored moving objects and focused on prominent features, like the large fish. Japanese participants, however, began with background details and recalled 60% more information about stationary objects and background elements. Most notably, Japanese participants were twice as likely to describe relationships and actions, such as noting that “the frog was climbing on the weeds.”
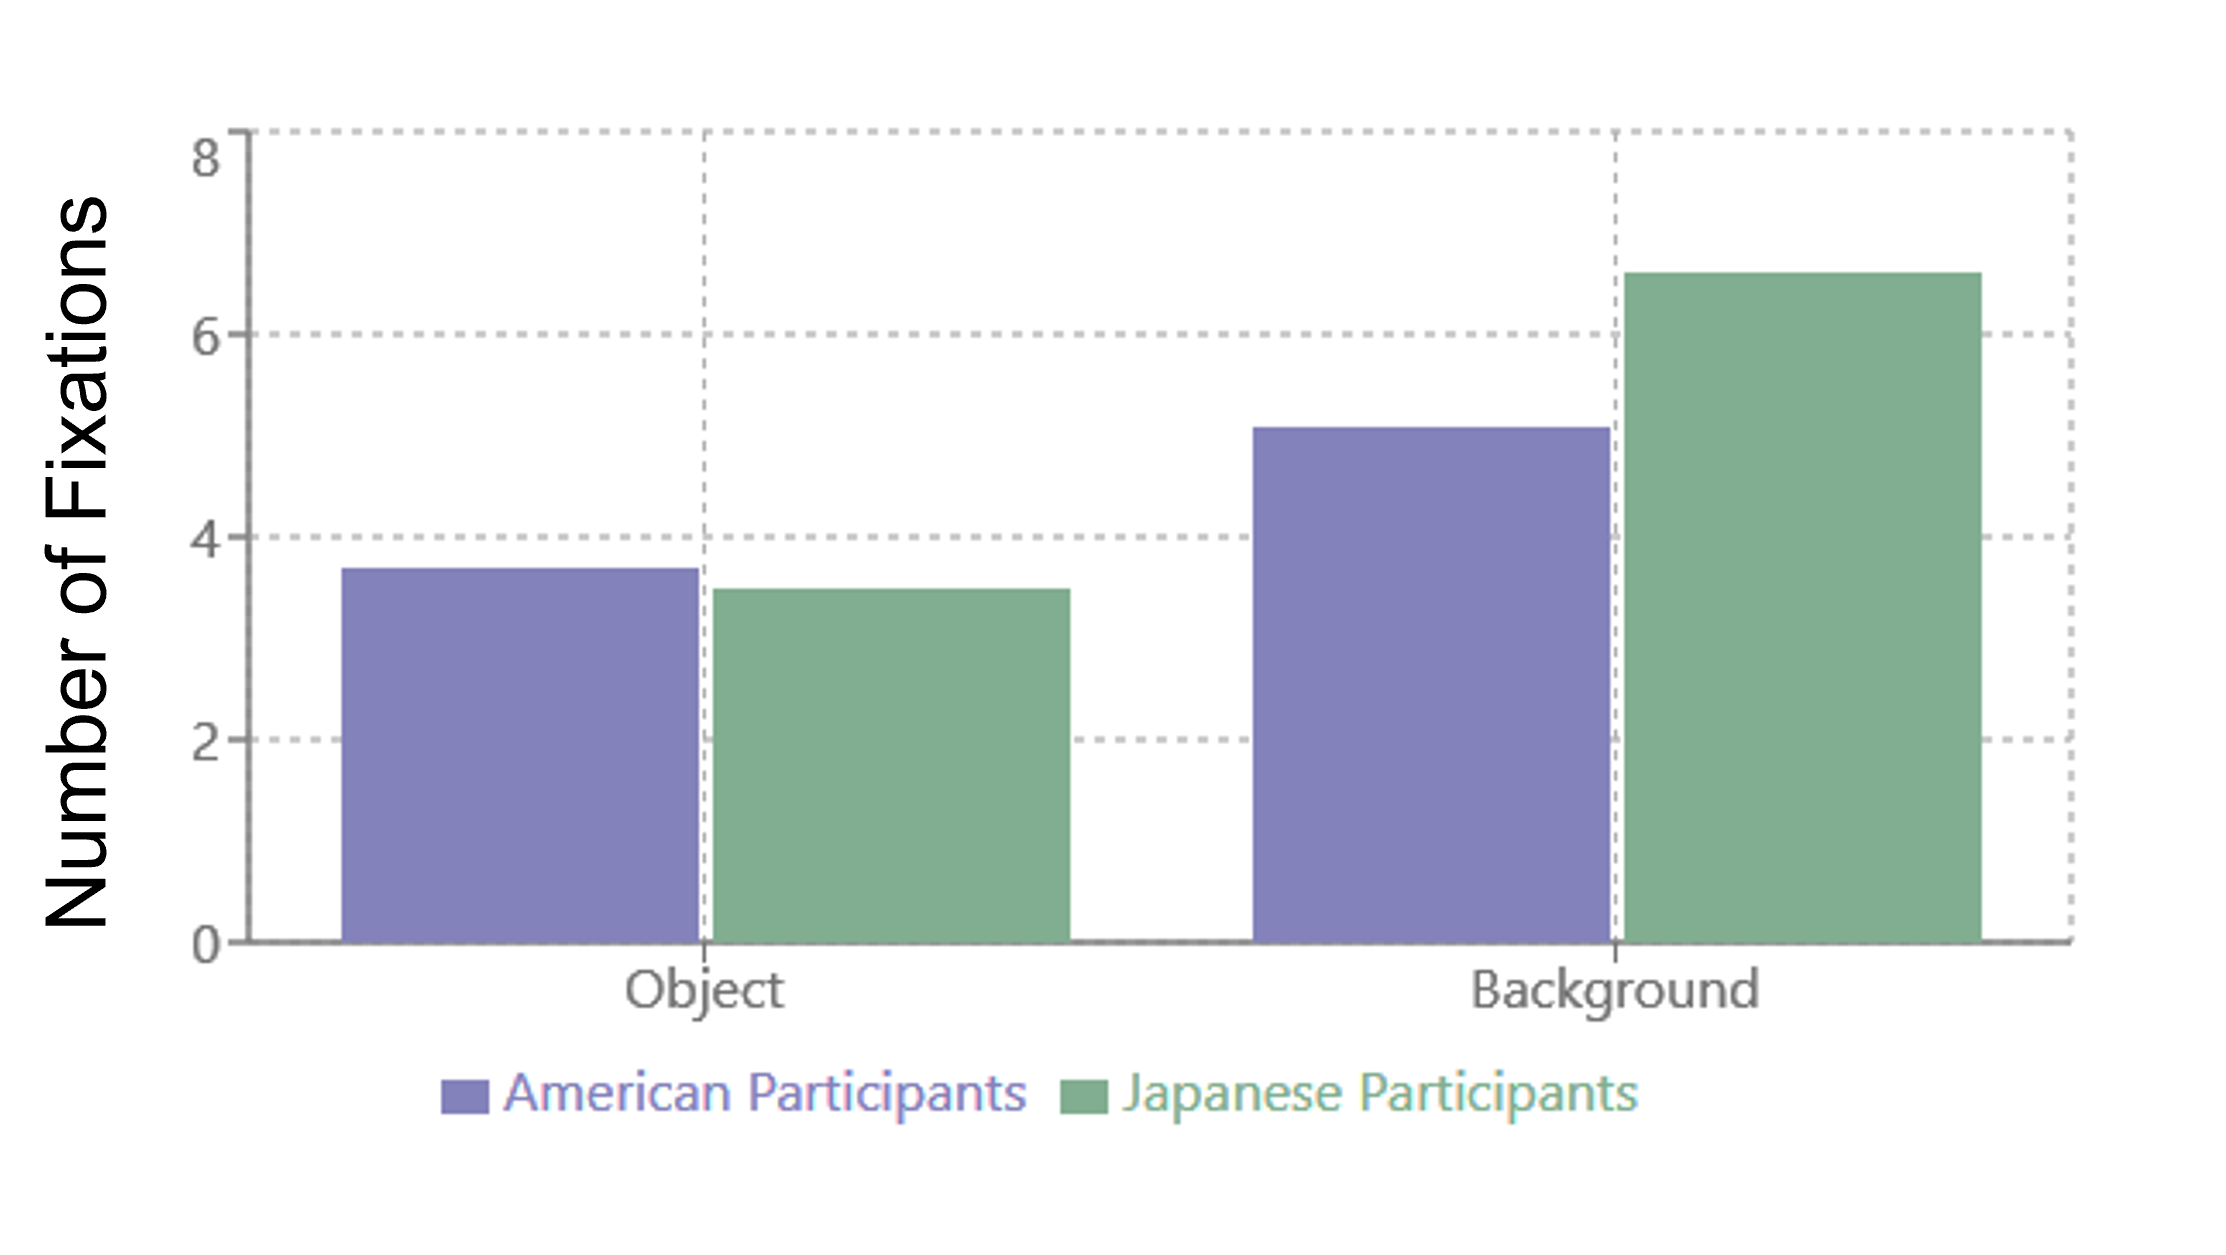
Chua et al. (2005) showed participants from the United States and China a series of photos and asked them to rate how much they liked them. They recorded their eye movements while they did this and found that Chinese participants looked more at the background objects than the US participants (see Figure 8.1). They both looked at central objects to the same degree, but the US participants were more likely to look at these objects first (Figure 8.1). After they had seen all the pictures, participants were given a surprise memory test. In the memory test, participants were shown a number of pictures and were asked whether they had seen them before. Some of the pictures were identical to the ones they had seen previously both in terms of central object and background, some had the same central object but a different background, and some were totally new. The Chinese participants were better at detecting whether or not the background was different to the original compared to the US participants.
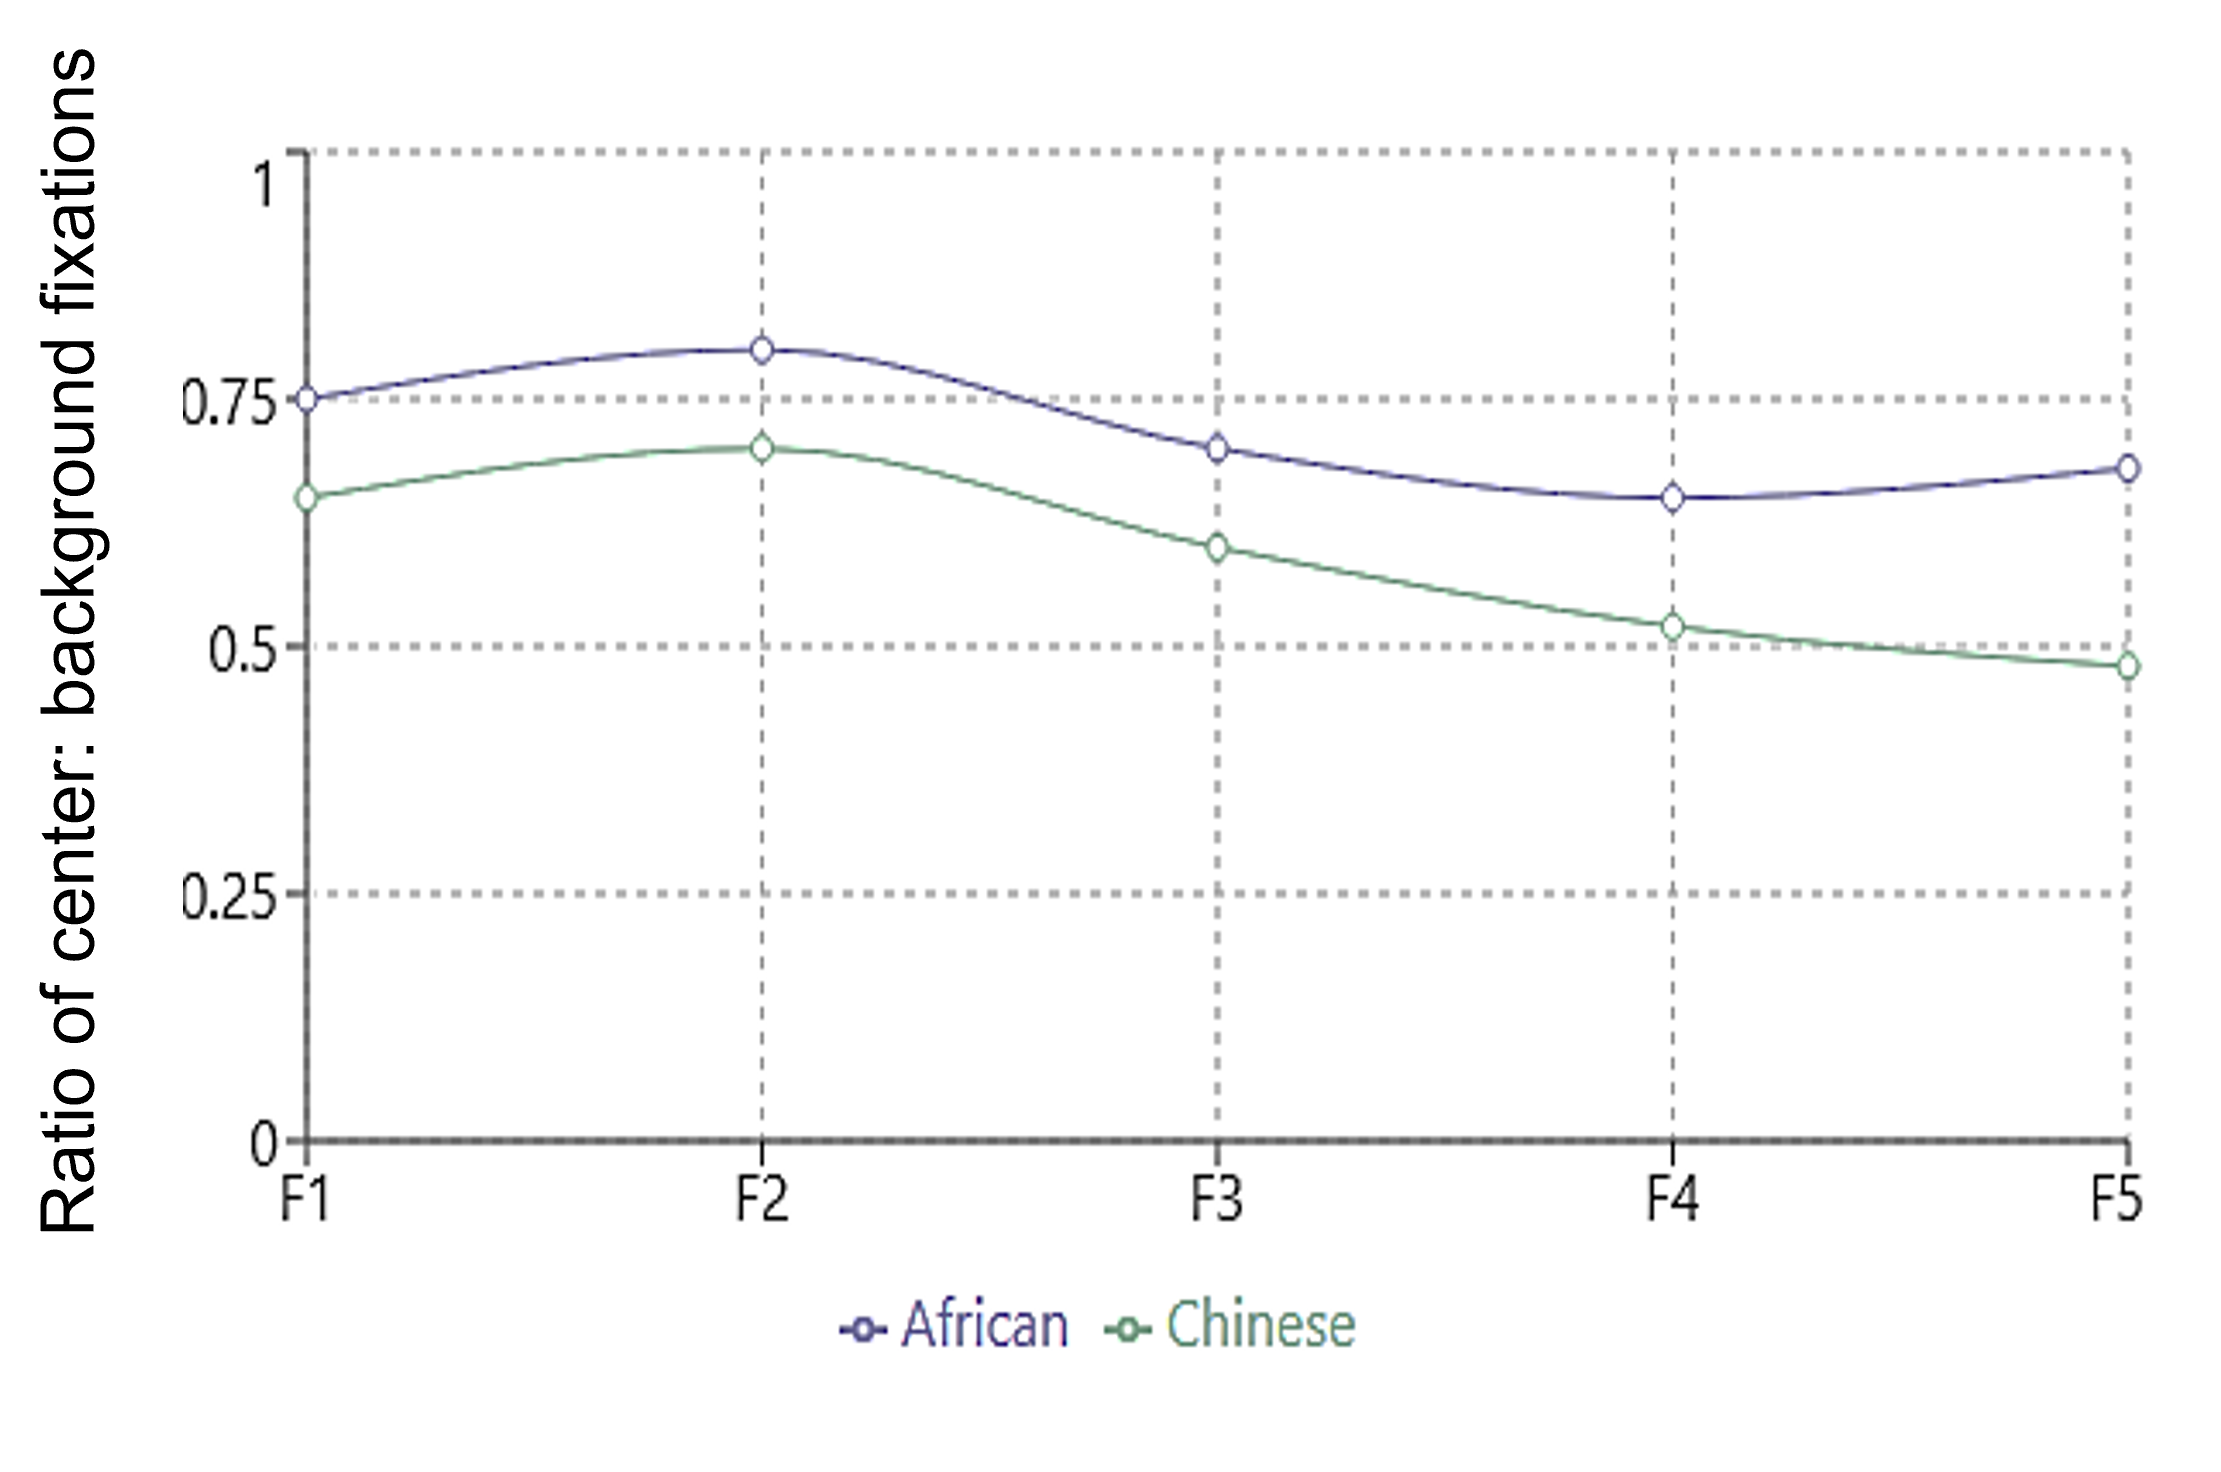
Duan et al. (2016) performed a similar eye tracking study with students from multiple African Countries and Chinese graduate students living in China. They hypothesized that although both cultures were more collectivistic than US participants, Africans were relatively more individualistic than Chinese students. Therefore, they hypothesized that the Chinese students would look at the background elements of the picture more than the African students. Their hypotheses were supported when they looked at the ratio of fixations made to the central object relative to the background for the first five fixations. The longer the participants looked at a picture, the less likely the Chinese participants were to look at the central object (see Figure 8. 2).
Masuda et al. (2012) investigated the extent to which faces in a group affected the perception of a central face. Participants were shown a series of photos where they had to rate how happy they perceived the center face in a group to be. The happy face was flanked on either side by two other people. In the congruent condition, all the facial expressions of the people in the group matched. In the incongruent condition, the center face had a different facial expression (either neutral or sad) to the flanking faces. Figure 8.3 shows a schematic of how this would look in the incongruent condition.

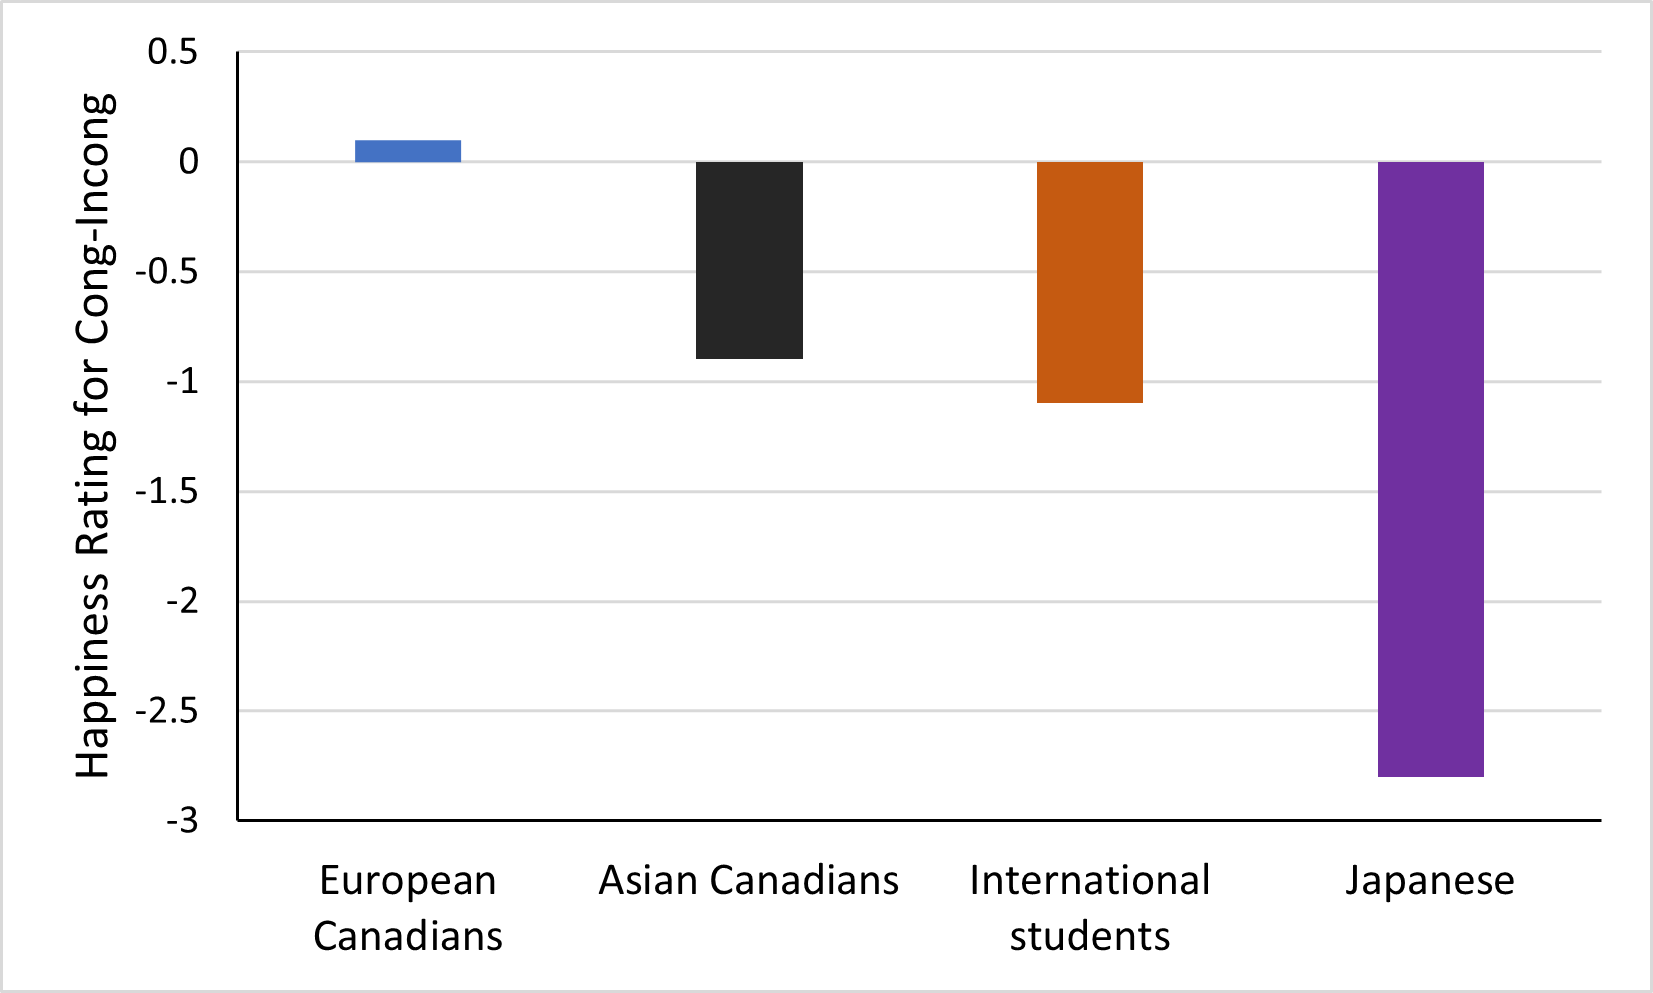
Figure 8.4 shows the extent to which participants judged the center face as happy by subtracting the scores of incongruent from congruent trials. The more negative numbers indicate that participants were more influenced by the incongurent facial expressions of the flanking faces. The Japanese participants were most influenced by the flanking faces. Asian Canadians and international students were affected to a much lesser degree and US students were not affected at all (Figure 8.4).
In a similar study, De Oliveira and Nisbett (2017) asked US, Brazilian, and Chinese participants to rate the intensity of the facial expression of the cartoon person in the center of the four other characters. Facial expressions included sad, happy neutral, and angry. There were no cultural differences in the ratings of angry faces, but for happy and sad expressions, Chinese participants were more influenced most by the facial expressions of the flanking faces when evaluating the intensity of the central face. In contrast, US participants were influenced the least, and Brazilian participants were somewhere in between the two other cultures.
A study by Caldara in 2017 revealed distinct cultural patterns in face scanning. When asked to identify a face, Western Caucasian observers typically focused on a triangular region encompassing both eyes and mouth, while East Asian observers concentrated more on the central region of the face. In contrast, when asked to identify the facial expression the eye movements were much more similar and included both the eyes and the mouth.
These cultural differences in visual attention to the central or peripheral parts of a scene were further demonstrated in Masuda et al.’s (2008) international study, which included participants from China, Japan, Korea, and Taiwan. When asked to photograph an individual, East Asian participants consistently included more background context in their photographs, while US participants tended to take close-up shots focusing on the person they were photographing.
Change Blindness
In their 2006 study of change detection, Masuda and Nisbett compared East Asian international students and US-born students from the University of Michigan. Participants viewed scenes with changes to either focal objects (the main object in the foreground) or contextual information. Participants from the US and East Asia tooka similar amount of time to see changes in the large, central objects, but US participants are slower to notice changes in the background (Masuda & Nisbett, 2006).
