Chapter 11: Hearing in Complex Environments
3
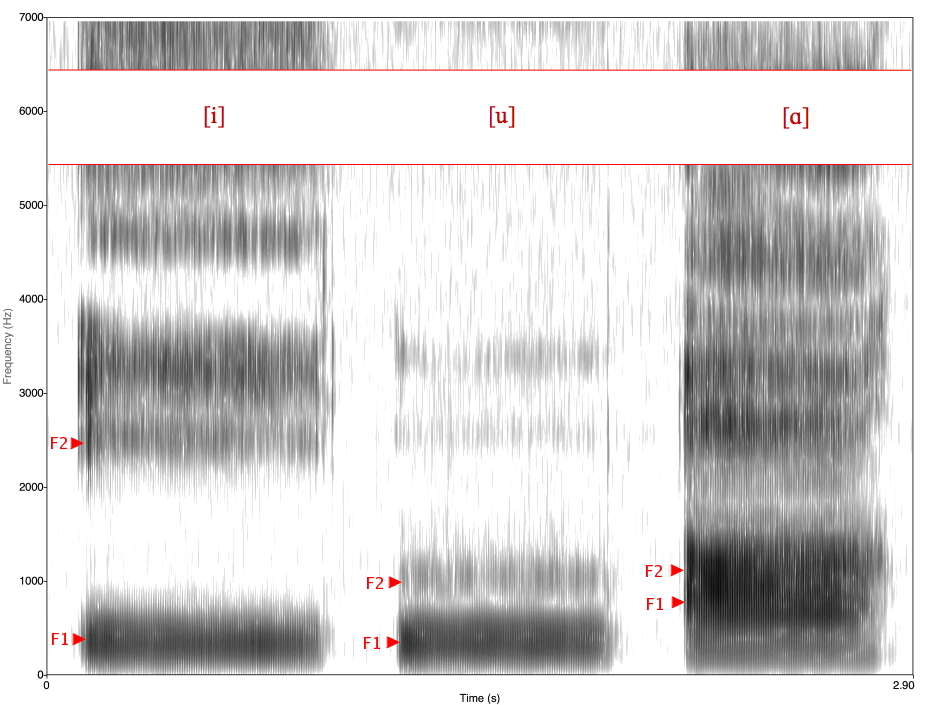
We can analyze the frequencies that are present in speech using spectograms. A spectrogram is a visual representation of how the frequencies in speech sounds vary with time. We can see for the three vowel sounds in Figure 11.6, each one has a distinct pattern of frequencies. The peaks in intensity at different frequencies (the dark bands) are called formants. The first formant (F1) for each sound is the one with the lowest frequency and gives the sound its basic pitch. F2 is the second formant, etc. All vowel sounds produce vibration of the larynx, which causes these formants. In contrast, constant sounds are very quick transitions in frequency before or after the vowel sounds.
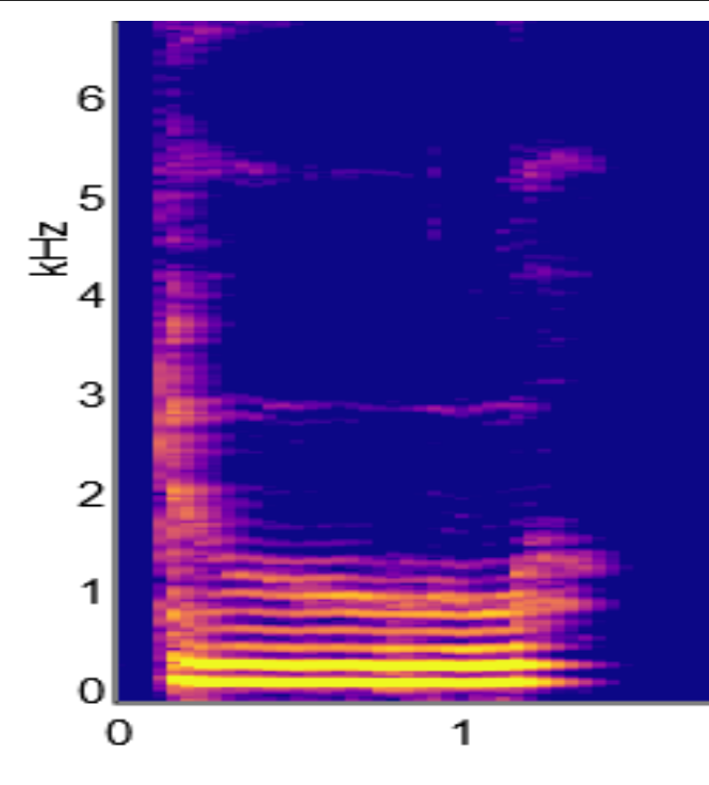
In Figure 11.7, we can see a spectogram of the phoneme – du. The easiest formant transitiona to see arethe rapid decrease in frequencies before the formant at about 3 Hz and 1 Hz. This is part of the “d” sound.
Cheryl Olman PSY 3031 Detailed Outline
Provided by: University of Minnesota
Download for free at http://vision.psych.umn.edu/users/caolman/courses/PSY3031/
License of original source: CC Attribution 4.0
Adapted by: Samuel KwongWikipedia, Spectrogram
Provided by: Wikipedia
URL: https://en.wikipedia.org/wiki/Spectrogram
License: CC BY-SA 3.0
Adapted by: Samuel Kwong and Caitlin Coan
