Chapter 3: Visual Pathways
3.2. Retinotopic Organization of V1 and Cortical Magnification
The primary visual cortex (V1) has both retinotopic organization and cortical magnification.
Retinotopic organization means that neurons with receptive fields close together in the retina have cell bodies close together in the cortex. Below is an interactive visualization of how the visual world is mapped to V1. What it shows is how signals from each retina are sent to V1 on the opposite side of the brain. Essentially, the image is flipped in our brain as signals from our left eye are processed and mapped by the right side of V1 and vice versa. Furthermore, the neurons that help map the image are spatially located in corresponding regions in V1. For example, a stimulus in one’s right hand visual field will be mapped by a neuron in the V1 region on the left side.
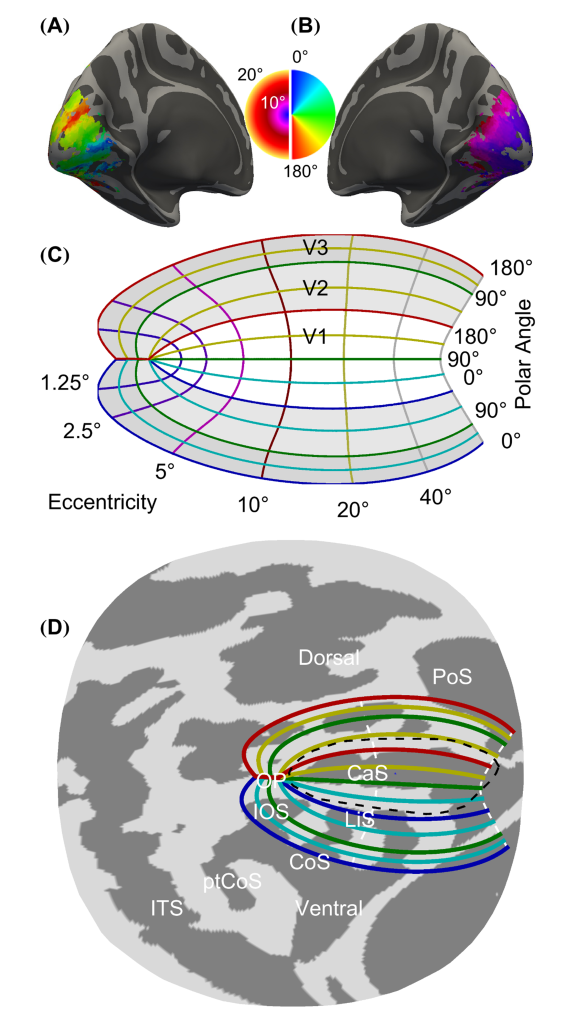
Area V1 has retinotopic organization, meaning that it contains a complete map of the visual field (visual map) covered by the two eyes (Figure 3.3).
Neurons in area V1 are classically divided into two types: simple and complex, based on the structure of their receptive field. Unlike retinal ganglion cells, the receptive fields are not round. In general, simple cells respond to rectangular shapes of different orientations, but simple cells are more likely to respond to bars or corners moving in a particular direction.
Cortical Magnification
Cortical magnification describes how many neurons in an area of the visual cortex are ‘responsible’ for processing information coming from different parts of the retina. We already know about the phenomenon of convergence. At the center of the fovea of the retina, a very large number of cones process information from a small region of the visual field. In contrast, information that stimulates the peripheral retina is processed by a much smaller number of photoreceptors. Convergence continues from the retina to the primary visual cortex. In general, the receptive field size increases at successive processing stages in the visual pathway and, at each processing stage, it increases with the distance from the center of the retina (eccentricity). The principle of cortical magnification is illustrated in Figures 3.3 A and B. Clearly, the central part of the retina (purple and pink) takes up a large part of the visual cortex, whereas the peripheral retina (green and red) takes up a much smaller part of the cortex. So, we can say that the cortical magnification is much greater for the fovea than the peripheral retina. Similarly, these neurons have small receptive fields if receiving information from the fovea and large receptive fields if receiving information from the peripheral retina.
The large receptive field size of neurons in the visual periphery explains the poor spatial resolution of our vision outside the point of fixation (other factors are photoreceptor density and optical aberrations). To become aware of the poor spatial resolution in our retinal periphery, try to read this line of text while fixating your eyes in a single letter. The letter that you are fixating is being projected at the center of your fovea where the receptive fields of retinal ganglion cells are smallest. The letters that surround the point of fixation are being projected in the peripheral retina. You will notice that you can identify just a few letters surrounding the point of fixation and that you need to move your eyes if you want to read the entire line of text.
Scholarpedia, “Area V1” by Matteo Carandini, University College London, London UK
URL: http://www.scholarpedia.org/article/Area_V1
License: CC BY-NC-SA 3.0
Adapted by: Frank Wiest-PuchalaCheryl Olman PSY 3031 Detailed Outline
Provided by: University of Minnesota
Download for free at http://vision.psych.umn.edu/users/caolman/courses/PSY3031/
License of original source: CC Attribution 4.0
Adapted by: Frank Wiest-Puchala
