8 2.1. The scientific approach and quantitative research
Western Psychology has relied heavily on quantitative research (using numbers) and the scientific approach to build its theoretical foundations. The study by Mehl and colleagues exploring gender differences in talkativeness (Mehl et al. 2007) that we just described is a good example of this. There are three basic features to using the scientific approach.
- Research strives to be systematic – Mehl and colleagues were careful and organized in their study design, data collection, and analysis. Scientific studies follow specific structures, which we will discuss in more detail below.
- Research is focused on an empirical question – In the study by Mehl and colleagues, the question was “Do women talk more than men?” Not all questions relevant to psychology are empirical, for example, consider the question: is there such a thing as free will? It would not be possible to collect data to answer this question.
- Research creates public knowledge. Psychologists, like other scientists, publish their work. This usually means writing an article in a peer-reviewed professional journal targeted for other scholars. The article explains their research question in the context of previous research, describes the methods used to answer their question, and clearly presents their results and conclusions.
Psychological knowledge is mostly based on theories. Theories are a well developed set of ideas that propose an explanation for observed behaviors we see in the world. For example, the research question that Mehl and his team were interested in relates to gender communication theories that attempt to explain how status affects the way men and women communicate in different contexts. Theories are typically based on multiple studies published by different researchers over many years. Despite researchers’ best efforts, sometimes methods are flawed and/or their conclusions incorrect. Publication allows others in the scientific community to detect and correct these errors, and so over time, theories become more refined and accurate. As we can see in Figure 2.2, knowledge that is built through the scientific process often changes over time.
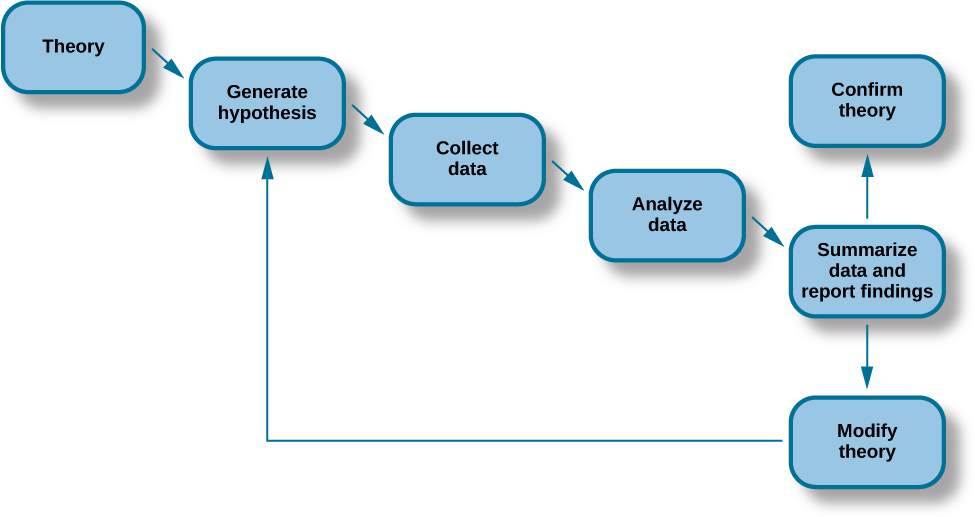
Theories are too complex to be tested all at once; instead, researchers create hypotheses to test specific aspects of a theory. A hypothesis is a testable prediction. For example, Mehl and colleagues hypothesized that women talk more than men. Then they set out to test their prediction by collecting and analyzing data (see Figure 2.2). They did not find support for their hypothesis, and so this in turn, contributes to gender communication theories. Interestingly, other studies have found evidence for gender differences in talkativeness. For example, male students tend to talk more than female students in college classrooms (Lee & McCabe, 2021) and women tend to talk more in public, than private settings (Crawford 1995; Tannen, 1990). Clearly, context has to be taken into account. Gender communication theories acknowledge that how much men and women talk depends on the situation. In psychology, studies based on the scientific method consist of three main types: experiments, quasi-experiments and correlational studies. Let’s take a look at experimental research first.
Experimental Research Studies

If somebody gave you $20 that you had to spend today, how would you spend it? Would you spend it on an item you’ve been wanting for weeks, or would you donate the money to charity? If you’re like most people, you’d choose to spend the money on yourself. But, which choice do you think would make you most happy? Professor Elizabeth Dunn’s research team at the University of British Columbia conducted TWO studies on whether giving to charities is connected to feeling happy (Dunn et al., 2008). One was a correlational study and the other was an experiment. In the experiment, they gave each of the participants $20 and then told half of the people they had to spend it on themselves. They told the rest of the people that they had to donate the money to charity. At the end of that day, both groups answered a question about how happy they felt. Those who made the donation reported feeling happier. Dunn and her colleagues concluded that giving money to others contributed to overall happiness. This research study used the scientific method. It was systematic and it asked an empirical question – Does giving money away make you happy? You can ask many different kinds of questions with experiments, but they all have the same basic design features. Let’s take a look at the features. Firstly, researchers always systematically change one variable, and then measure the impact of those changes on another variable. A variable is just something we can vary or measure in some way. The variable that is under the experimenters’ control is called the independent variable. In the case of Dunn et al.’s experiment, the independent variable was how the participants spent the money. There were two conditions (options) – spend it on themselves or on others. The researchers (not the participants) decide on the options. This is what we mean by manipulating a variable. Experiments investigate whether the independent variable causes a change in the dependent variable. In this example, the participants’ happiness is the dependent variable, because it depends on how the participants spend their money (independent variable). The independent variable is often thought of as the “cause” and the dependent variable – “the effect” (see Figure 2.4). Dr. Dunn was able to conclude that group differences in happiness were caused by how the money was spent.

Did the results of Dr. Dunn’s study surprise you? If they did, you might be feeling a little bit skeptical about the results of this study. You might be thinking—doesn’t happiness depend on a lot of different factors—including a person’s upbringing or life circumstances? What if some people had happy childhoods and that’s why they’re happier? Wouldn’t people who are having a bad day feel less happy? You are absolutely right and you are thinking like a scientist! All of these factors (and many more) can easily affect a person’s level of happiness. So, how can we take all of these different variables into account? A second feature of experiments that helps to compensate for these individual differences across people, is that they all use random assignment. In other words, participants cannot pick which group they are in, the experimenter assigns them to a particular condition or group randomly. This might be based on the flip of a coin, the roll of a die, or the generation of a random number by a computer. Random assignment makes it so the groups are relatively similar on all characteristics, except the one that the experimenter wants to manipulate. In Dunn’s study, there should be equal numbers of people with happy childhoods and equal numbers of people who were having a bad day in each group.
Some experiments are conducted to see whether an intervention has an effect on behavior, for example, psychologists might be interested to know whether a certain type of drug or therapy improves symptoms of depression more than another. Researchers manipulate the independent variable by randomly assigning participants to an experimental group (who are given the drug being tested) and the control group (who are given a sugar pill—also known as a placebo). Researchers often conduct studies like this using “blinding”. A single–blind design is one where participants do not know which group they are in and so their expectations are less likely to influence the results. Nevertheless, participants in the control group sometimes believe that they received the actual drug and show signs of improvement or even side effects—this is known as the placebo effect. That is why a control group is so important, the drug must have significantly greater benefits than the placebo in order to be considered effective. In double-blind studies, the researchers are also unaware of the group assignments until after the study is completely finished. This reduces experimenter expectations and biases when analyzing the data. In experiments, there always has to be at least comparison group/condition in order to know whether the manipulation of the independent variable had any effect. In the case, of Dunn’s study, she hypothesized that prosocial spending, i.e., giving money to others would lead to greater happiness than self-spending, so we can consider those who were in the donation group as the experimental group while the other participants were in the control group.
Another aspect of experiments is that the dependent variable must be quantifiable, in other words, it must be measurable in some way using numbers. In the experiment on happiness and giving to charity you just read about, Dunn’s team asked participants a single question: Do you feel happy on this day? Participants used a rating scale from 1 to 5 (like the one shown in Figure 2. 5) to indicate how happy they felt (5 = most happy).

Psychologists use statistics in quantitative studies to assess whether groups differences in the dependent variable are meaningful and reliable, or merely due to chance. In experimental research, there is a tremendous amount of control over the variables of interest. This is a powerful approach. However, psychology experiments are often conducted in artificial settings, like labs, and complex phenomena are reduced to simple numbers. It is sometimes difficult to know whether experimental findings would apply in real-world settings. This is one of the reasons why it is important that psychology as a discipline includes multiple types of research methods to build knowledge about the mind and behavior.
Quasi-Experimental Designs
Remember the study that you read about in the beginning of this chapter where Mehl and colleagues looked at gender differences in talkativeness (Mehl et al., 2007)? This study also has an independent variable—gender, and a dependent variable—talkativeness. But, psychologists cannot manipulate gender or use random assignment for their male and female groups, gender is already determined. The study design that Dr. Mehl used is known as a quasi-experiment; but, it is similar to a regular experiment. Let’s look at another example to distinguish between these two different types of design. Imagine you want to know who is a better professor: Dr. Smith or Dr. Khan? To judge their ability, you’re going to look at their students’ final grades. Letter grades can easily be turned into numbers. Here, the independent variable is the professor (Dr. Smith vs. Dr. Khan) and the dependent variable is the students’ grades. In an experimental design, you would randomly assign students to one of the two professors and then compare the students’ final grades. However, in real life, researchers can’t randomly force students to take one professor’s class over another. Instead, the researchers would just have to study the classes as they stand (quasi-experimental design). Students’ choice of professor may seem random, but it’s most likely not. Students often hear things about professors that affect their enrollment. Maybe Dr. Khan has a reputation for being kind and so more students want to take her course. But, because some schools allow Honors students (who typically have better grades than other students) to register first, Dr. Khan’s class could have more honors students than Dr. Smith’s and this might affect the average grades in the class. So, even though a quasi-experimental design is similar to an experimental design (i.e., it has independent and dependent variables), because there’s no random assignment you cannot reasonably draw the same conclusions that you would with an experimental design. However, quasi-experiments are still very useful in providing information about different groups of people, based on various aspects of their identity, or their demographics.
Correlational Designs
In correlational research, scientists do not intervene and measure changes in behavior. Instead, they passively observe and measure variables and identify patterns of relationships between them. So, they can make predictions about relationships between two variables, but they cannot make conclusions about cause and effect. Dr. Dunn’s team first conducted a correlational study with a different set of participants than those in her experiment. She asked participants in the correlational study how much of their income they donated to charity in the past month; she later asked them how happy they were (using the 5-point scale). Then they looked at the relationship between the two variables. Dunn found that the more donations people made to charity; the happier they reported feeling. We call this a correlation and we measure the strength of the relationship using statistics. To find out how well two variables relate to each other, we create a scatterplot (see Figures 2.6 and 2.7). In the scatterplot, each dot represents a data point. In Figure 2.6, each point represents a participant in the study. Importantly, each dot provides us with two pieces of information—in this case, donations in the past month (x-axis) and how happy the person felt (y- axis).
. Noba Project.")
We have added a best fit (dotted) line through the data in Figure 2.6, the line represents the average relationship between the two variables. It has equal numbers of points above and below it. The relationship between two variables can also be summarized statistically using the correlation coefficient (abbreviated as r). The sign of r (positive or negative) indicates the direction of correlation. In Figure 2.6, the line slopes upwards, therefore, r is a positive number (+0.81) indicating that the data show a positive correlation. In other words, the variables move in the same direction – as one goes up so does the other. Low donations correlate with low happiness, and high donations with high happiness ratings.
. Noba Project.")
Figure 2.7 shows the data from a different research study. We see the relationship between average height of men in different countries on the y-axis and the prevalence of a pathogen (something that causes disease) in each country on the x-axis. Each dot represents a different country. The line of best fit slopes downwards because there is a negative correlation between the two variables. We can see that countries with taller men have lower incidence of the pathogen and vice versa. In other words, as one variable (height) goes up, the other one (pathogen prevalence) goes down. In Figure 2.7, the correlation coefficient (r = -0.83) is a negative number.
The strength of a correlation tells us about the closeness of the relationship between the two variables. If all the points sat on the best fit lines, this would be the very strong relationship and r would be 1 or -1 (depending on the direction of the association). The higher the absolute value of r, the stronger the relationship. Absolute value means that we ignore the +/- sign. Perhaps you can see that the dots are a little closer to the line in Figure 2.7 compared to Figure 2.6? This is because the absolute value of r is slightly larger ( a stronger correlation) for Figure 2.7 (-0.83) compared to Figure 2.6 (+0.81). The relationship between variables can vary from strong to weak. Sometimes, r is so low (close to zero), that we say there is no correlation, or the variables are uncorrelated, and the best fit line would be horizontal or flat.
Correlation is NOT causation
Correlational studies like the ones we see in Figures 2.6 and 2.7are very useful for making predictions about the relationships between two variables. They are usually cheaper and less time consuming to run than experiments. However, correlational studies cannot tell us whether one variable causes the other. In the case of Dr. Dunn’s study on charitable giving and happiness, she ran the correlational study first and found a significant correlation between the two variables. However, she could not conclude that giving to charity caused happiness. It is possible that a third variable (that she did not measure) such as wealth, might be linked to both happiness and generosity. So, correlation is NOT the same as causation. However, the results of the correlational study, gave Dr. Dunn the motivation to conduct a follow-up experiment to explore cause and effect. She was able to randomly assign participants to give away or keep the money she gave them. Only then was she able to draw the conclusion that donating to charity made people happier.
Research Participants
As we mentioned at the beginning of this chapter, psychologists using the scientific approach have to design their studies in a very systematic way. We have seen some evidence of this already in our discussion of experimental design. In addition, researchers must determine the number of participants they need in each study, as well as their characteristics (e.g., age, gender, socioeconomic status, etc.). The characteristics of the research participants should be described in detail. The research question often determines who the researchers recruit for a particular study. For example, if researchers are investigating causes of depression in the elderly in New York City, then it would not be prudent to recruit college students, or people who live outside of New York City. However, it is not practical to test every elderly person in the area. Instead, psychologists try to recruit a sample (a subset) of elderly people. Ideally, the sample should be random and large enough to be representative of the population of New York City. This means that the percentages of specific characteristics in the sample (sex, ethnicity, socioeconomic level, and any other characteristics that might affect the results)are close to those percentages in the population of elderly people in NYC.
Operational Definitions
Researchers must also decide on very precise definitions of how they will measure the variables. We call these operational definitions—because they determine how the study will be run (operated). When a study is published, these methods should be described in detail—just like a cooking recipe, so that another researcher should be able to duplicate the study exactly. For example, if you wanted to measure happiness – what measure would you use? We know that Dunn and colleagues used a rating scale, like the one shown in Figure 2.5. Notice that she asked the participants to rate how they felt “on this day”, rather than “right now” or “during this week, month or year”. She also had to operationally define the independent variable – by deciding how much money to give each person ($20), how long participants had to spend the money (1 day), and what they could spend the money on (spend on yourself, give to a charity). There are many different ways to measure psychological variables, but remember that scientific studies require that we quantify (use numbers to measure) the data in some way. Each answer needs to be turned into a number for analysis. This allows psychologists to display data in graphs and use statistics to draw meaningful conclusions. Let’s take a look at some of the different ways that psychologists gather data from participants.
 https://commons.wikimedia.org/wiki/File:Fragebogen_zur_Wikipedia_-_YOU_Berlin_2008_(6566).JPG")
Data Collection Methods
Surveys are among the most common way to collect psychological data. Participants complete questionnaires and the scores from each question are aggregated (summed together). Surveys can be administered in person or sent by mail/email; they can also be administered online. Alternatively, psychologists may collect other kinds of data, such as counting the number of words a person speaks over the course of a few days (Mehl et al., 2007), or measuring how quickly they walk, or whom they sit next to in the cafeteria. Psychologists might measure participants’ brain responses to various sounds or pictures, or how quickly they respond to them by pressing a button. Throughout this book, you will read about many of the different measures that psychologists use to draw conclusions about the mind and behavior.
Criticisms of Quantitative Psychological Research
Although most quantitative studies seek to generate generalizable findings, the vast majority of study participants are not representative of the general population of the USA, much less the world. Most psychology research has been conducted with participants from WEIRD (White, Educated, from Rich, Industrialized, Democratic) cultures, and so are not representative of the global majority. A very large percentage of studies use college students as research participants, because they are a convenient sample (Sears, 1986; Arnett, 2008). Relying on such a limited pool of research participants can be problematic, college students tend to be younger, more educated, more liberal, and less diverse than the general population.
Scientific research is often upheld as being highly objective. Indeed, it is very systematic in the way data are measured and analyses conducted. As we have already mentioned, double-blind studies can be used to improve objectivity by reducing participant and experimenter bias (the influence the participants and researcher has on the study). However, in general, much less attention has been paid to the issue of researcher bias in terms of how our lived experiences affect the research we conduct. For example, if a research team is conducting a quasi-experiment on how intelligence varies across race and/or gender, they might require that participants come into their lab to be tested. From the very beginning, an experimenters’ behavior toward the participants (welcoming, smiling, friendly) might vary depending on the participant’s characteristics (such as gender, race, socioeconomic status) which in turn could affect how the participants perform on the test. As you will read in the upcoming chapter on Intelligence, in the 1930s, Black researchers like Horace Mann Bond and George Herman Canady found that White psychologists often took time to develop rapport with White, but not Black children, when conducting psychological testing. They also found that Black children scored higher on intelligence tests if they were tested by a Black, rather than a White, examiner. Among more recent studies, not all have found that the examiner’s race affects performance on psychological tests (Sattler & Gwynne, 1982). However, a significant number of studies have found that when the participants were feeling stressed or threatened by the test, they performed better when tested by someone of the same race/ethnicity as themselves (Moore & Retish, 1974; Nagra et al., 2007; Thames et al., 2013).
Similarly, a researcher’s own personal identity (including but not limited to age, race, gender, sexual orientation, socioeconomic status, nationality and language, health history, and dis/ability) and lived experiences are likely to influence the kinds of research questions they ask, the measures they use, and how they interpret their data. For example, increased diversity among psychologists over time has resulted in a greater focus on social justice issues in the field in general. However, the field of psychology continues to be dominated by White psychologists. In 2021, about 80% of psychologists and 87% of neuropsychologists were White (American Psychological Association, 2022; Klipfel et al., 2023). Regardless of race, it is of paramount importance for all psychologists to consider whether the measures they use are culturally appropriate for all research participants. Ethnocentric behaviors among psychologists can negatively impact the people they are meant to serve. Recently, a group of Black psychologists have drawn attention to the cultural inappropriateness of an item within the Boston Naming Test—a commonly used test for assessing language abilities, especially among people who may have brain damage. In the test, people are asked to name what they see when shown various simple black and white drawings. One of the 60 pictures is a drawing of a noose, which Black and Brown clients find highly distressing because of its strong association with hatred and violence toward African Americans. This distress can affect performance on the naming task and other subsequent tests. Professor Desiree Byrd and colleagues have shone a spotlight on the fact that this picture has been included in the test for over 40 years, but the field of psychology has failed to recognize the violence caused to people of color by the inclusion of this image. Byrd and colleagues have called for psychologists to stop administering the Boston Naming Test until the offensive picture has been removed (Byrd et al., 2021). You will see a greater discussion of racism in psychology in the upcoming section on Intelligence.
Replication Crisis
Successful replications of published research studies make psychologists (and scientists in general) more apt to adopt those findings, but repeated failures tend to cast doubt on the legitimacy of the original article and lead scientists in different directions. For example, we might be eager to take a new drug if a study shows it improves peoples’ memories. But if other scientists cannot replicate the results, we would question the original study’s claims.
In recent years, there has been increasing concern about a “replication crisis” that has affected a number of scientific fields, including psychology. Some of the most well-known scientists have produced research that has failed to be replicated by others (as discussed in Shrout & Rodgers, 2018). In some cases, this might be explained in part by a lack of transparency in how the research was carried out; there may be important details missing from the original article that make the “recipe” hard to follow precisely, or participants may not be adequately described. Also, sample sizes (numbers of participants) in the original studies were often too small and not representative of the general population. There is also a publication bias in psychology, where journals typically only publish significant results that confirm hypotheses, whereas studies that fail to show significant differences between conditions are not made public. Finally, although psychologists are bound by a code of ethics, a very small number of researchers falsified their results—this is the scientific equivalent of fake news. When false reports are discovered then studies are often rescinded or retracted from the scientific journals. Unfortunately, fake scientific news can sometimes have very disturbing and widespread consequences. One example of this comes from false data about side effects of vaccinations in the field of medicine. In 1998, a team of doctors in the UK led by Andrew Wakefield published a study on 12 children in a highly influential journal called The Lancet, claiming that autism was linked to the measles, mumps, and rubella (MMR) vaccine. Subsequently, the article has been retracted, and the main author, Wakefield, has been discredited by indisputable evidence that he falsified the data. He also failed to get proper consent from the participants and their parents. Since then, many, many other studies have overwhelmingly shown that vaccination is NOT linked to autism. However, Wakefield’s article got a lot of media attention, and parents became reluctant to vaccinate their children, despite the fact that measles can result in blindness, encephalitis (swelling of the brain), pneumonia, and even death. This legacy continues today; increasing numbers of children are unvaccinated and the prevalence of measles is rising dramatically in Europe and the USA (Godlee et al. 2011; Offit & Coffin, 2003; Taylor et al., 2014).
