30 4.2. What is Sleep?
We spend approximately one-third of our lives sleeping. Given the average life expectancy for U.S. citizens falls between 73 and 79 years old (Singh & Siahpush, 2006), we can expect to spend approximately 25 years of our lives sleeping. Why do we devote so much time to sleeping? Is it absolutely essential that we sleep? The two following sections will consider these questions and explore various explanations for why we sleep.
What is Sleep?
Sleep is characterized by low levels of physical activity and reduced sensory awareness. Sleep is regulated by circadian rhythms and homeostatic mechanisms (Siegel, 2008). Homeostatic regulation of sleep is evidenced by sleep rebound following sleep deprivation. Sleep rebound refers to the fact that a sleep-deprived individual will fall asleep more quickly during subsequent opportunities for sleep. Sleep is characterized by distinct stages of brain activity of the brain that can be visualized using electroencephalography (EEG). Sleep-wake cycles are controlled by multiple brain areas acting in conjunction with one another. Some of these areas include the thalamus, the hypothalamus, and the pons (Figure 4.6).
Sleep is also associated with the secretion and regulation of a number of hormones that are important for growth, immune system function, reproduction, and other metabolic functions. As previously mentioned, the pineal gland releases melatonin during sleep (Figure 4.6), which is involved in the regulation of various biological rhythms and immune system function (Hardeland et al., 2006). During sleep, the pituitary gland secretes both FSH and LH which are important in regulating the reproductive system (Christensen et al., 2012; Sofikitis et al., 2008). The pituitary gland also secretes growth hormone, during sleep, which plays a role in physical growth and maturation, as well as other metabolic processes (Bartke et al., 2013).

Sleep is not a uniform state of being. Instead, sleep is composed of several different stages that can be differentiated from one another by the patterns of brain wave activity that occur during each stage. EEG recordings allow us to measure changes in the frequency and amplitude of brain waves in different sleep stages. The frequency of a brain wave is how many peaks(or oscillations) occur in a second and it is measured in Hertz (Hz). The amplitude is the height (size) of the brain wave. While awake, our EEG is dominated by high frequency brain waves called beta waves (13-30 Hz). Each EEG electrode measures average brain activity from the overlapping peaks and troughs produced by thousands of neurons. When we are awake, the brain is very active and neurons are more variable in the frequencies they produce and so the amplitude of the EEG is low. As we begin to fall asleep, our brain wave activity changes. Sleep can be divided into two different general phases: rapid eye movement (REM) sleep and non-REM (NREM) sleep.
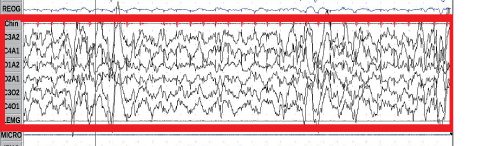
REM sleep is characterized by darting movements of the eyes under closed eyelids. Brain waves during REM sleep appear very similar to brain waves during wakefulness. The pons is important for regulating REM sleep (National Institutes of Health, n.d.). NREM sleep is subdivided into three different stages. When we first fall asleep, we typically cycle through the three stages of NREM sleep, followed by a period of REM sleep. In this section, we will discuss each of these sleep stages and their associated patterns of brain wave activity (Figure 4.7).
")
NREM Stages of Sleep
As we begin to fall asleep, we enter NREM sleep, and brain wave patterns decrease in frequency and increase in amplitude, indicating that the brain activity is becoming more synchronized and less variable. This increased EEG amplitude indicates that the brain is less busy now. The first stage of NREM sleep is known as stage 1 sleep. Stage 1 sleep is a transitional phase that occurs between wakefulness and sleep, and occurs when we first drift off to sleep. During this time, both our respiration and heartbeat slow down, and we experience a marked decrease in overall muscle tension as well as a decrease in core body temperature.
The early portion of stage 1 sleep produces alpha waves (8–12 Hz), which can also be produced when someone is very relaxed and awake (Figure 4.8). In the later parts of stage 1 sleep, there is an increase in theta wave (4–7 Hz) activity. It is relatively easy to wake someone from stage 1 sleep; in fact, people often report that they have not been asleep if they are awoken during this sleep stage.

As we move into stage 2 sleep, the body becomes deeply relaxed. Theta waves still dominate the activity of the brain, but they are interrupted by brief bursts of high frequency activity known as sleep spindles (Figures 4.8 and 4.9). Sleep spindles may be important for learning and memory (Fogel & Smith, 2011; Poe, et al., 2010). In addition, stage 2 sleep is often associated with the appearance of K-complexes. A K-complex is a very high amplitude pattern of brain activity that may, in some cases, occur in response to environmental stimuli. Thus, K-complexes might help us to know what is going on in our environment even when we are asleep (Halász, 1993; Steriade & Amzica, 1998).

NREM stage 3 sleep is often referred to as deep sleep or slow-wave sleep because this stage is characterized by low frequency (less than 3 Hz), very high amplitude delta waves (Figure 4.10). Slow wave sleep is regulated by the hypothalamus and the thalamus (National Sleep Foundation, n.d.). During this time, an individual’s heart rate and respiration slow dramatically, and it is much more difficult to awaken someone from sleep during stage 3 than during earlier stages. Individuals who have increased levels of alpha brain wave activity (more often associated with wakefulness and transition into stage 1 sleep) during stage 3 sleep often report that they do not feel refreshed upon waking, regardless of how long they slept (Stone et al., 2008).
REM Sleep
As mentioned earlier, REM sleep is marked by rapid movements of the eyes. The brain waves associated with this stage of sleep are very similar to those observed when a person is awake, as shown in Figure 4.11, this is the period of sleep in which most dreaming occurs. REM sleep is also associated with paralysis of large muscle systems in the body, with the exception of those concerned with circulation and respiration. Therefore, no movement of large voluntary muscles occurs during REM sleep in a normal individual; REM sleep is often referred to as paradoxical sleep because of the high level of brain activity but lack of muscle tone. Like NREM sleep, REM has been implicated in various aspects of learning and memory (Wagner et al., 2001; Siegel, 2001).

If people are deprived of REM sleep and then allowed to sleep without disturbance, they will spend more time in REM sleep in an effort to recoup the lost time in REM. This is known as REM rebound, and it suggests that REM sleep is also homeostatically regulated. In addition to the role that REM sleep may play in processes related to learning and memory, REM sleep may also be involved in emotional processing and regulation. In such instances, REM rebound may actually be an adaptive response to stress in nondepressed individuals, because it reduces the emotional salience of aversive events that occurred during the day (Suchecki et al., 2012). The hypnogram below (Figure 4.12) shows a person’s passage through the stages of sleep. We cycle through the different stages of sleep through the night, but we have more slow wave sleep in the early parts of the night and more REM sleep later on.

Link to Learning
View this video about sleep stages to learn more.
