40 5.2. Vision
The visual system constructs a mental representation of the world around us (Figure 5.5). This helps us to successfully navigate through physical space and interact with other individuals and objects in our environments. This section will provide an overview of the basic anatomy and function of the visual system. In addition, we will explore our ability to perceive color and depth.
")
Anatomy of the Visual System
The eyes work a little like a camera (Figure 5.6). Light passes first through the cornea, then the pupil and lens to reach the receptors at the back of the eye. The cornea is the transparent covering over the iris. It serves as a barrier between the eye and the outside world, and helps to focus the light as it enters the eye. The pupil is the small opening in the iris (colored part of the eye). When it is dark, the pupil dilates (expands) to allow more light to enter the eye. When it is very bright, the pupil will constrict to reduce the amount of light that enters the eye. Pupil size is controlled by the muscles in the iris. The size of the pupil is affected by the autonomic nervous system, it becomes large when we are scared or emotionally aroused (sympathetic NS) and smaller when we are resting and digesting (parasympathetic NS).

The lens is attached to muscles that can change its shape so that we can see objects that are close to us, as well as those that are far away. Ideally, the optics of the eye (cornea and lens) produce a picture of the outside world that is perfectly focused on the retina at the back of the eye. The retina contains specialized photoreceptor cells called rods and cones (Figure 5.7). Cones work best in bright light conditions, they are sensitive to detail (like small letters), and help us to perceive color. At the very center of the retina, there is a tiny area, called the fovea, which has only cones. When we are looking directly at an object, e.g., when reading, we move our eyes so the words fall on the fovea, this allows us to see them better. The rest of the retina is important for our peripheral vision and contains both rods and cones. Rods work well in low light conditions, and while they are unable to detect color and fine detail, they help us to see general shapes in dimly lit environments and to detect movement in our peripheral vision.

The different sensitivities of rods and cones are apparent when we compare our vision in a brightly lit environment to a dark one. Imagine you are at home in the evening. The lights are on and you can see the small print in your textbook without much effort and you can also easily avoid eating the orange candies you dislike from the packet of candy that you are eating. But, suddenly, there is a power cut and the lights go out. It’s impossible to continue reading. You decide to console yourself by eating the rest of your candy, but, you can no longer see which ones are orange. You can see the basic outlines of the furniture and so you make your way to bed instead.
Rods and cones are connected (via interneurons) to retinal ganglion cells. Axons from the retinal ganglion cells converge to form the optic nerves, which exits at the back of each eye. The optic nerves carry visual information from the retina to the brain. There are no receptors where the optic nerve leaves the eye, which results in a blind spot in each eye. We are not consciously aware of our blind spots for two reasons: First, each eye gets a slightly different view of the visual field; therefore, the blind spots do not overlap. Second, even if we are looking with just one eye, our brain fills in what it thinks is in the blind spot so we unaware that information is missing.
The optic nerve from each eye merges at a point called the optic chiasm before it reaches the thalamus. As you can see in Figure 5.8, the optic chiasm is an X-shaped structure. Information from the right visual field (from both eyes) is sent to the left side of the brain, and information from the left visual field is sent to the right side of the brain.

Link to Learning
We can “see” our blind spot under certain conditions. This video will show you how. Tip: you probably need to be about 4 inches from your computer screen to experience this.
Visual information is sent via the thalamus to the primary visual cortex in the occipital lobe at the back of the brain for initial processing. Visual information is then sent to other parts of the brain (association areas) via two major pathways (see Figure 5. 9). The “what” pathway, which projects to the temporal lobe, is involved in object recognition and identification. While the “where/how” pathway projects to the parietal lobe and is involved with processing the location and movement of an object (Milner & Goodale, 2008; Ungerleider & Haxby, 1994). For example, when you see a red ball rolling down the street, the “what” pathway helps you to know what the object is, and the “where/how” pathway helps you to intercept it and pick it up.

What Do You Think?
Ethics of Research Using Animals
David Hubel and Torsten Wiesel were awarded the Nobel Prize in Medicine in 1981 for their research on the visual system. They collaborated for more than twenty years and made significant discoveries about the neurology of visual perception (Hubel & Wiesel, 1959, 1962, 1963, 1970; Wiesel & Hubel, 1963). They studied mostly cats and monkeys. Although they used several techniques, they did a considerable amount of single unit recordings, where they inserted tiny electrodes in the animal’s brain to determine when a single cell was activated. Among their many discoveries, they found that the retina mapped onto the visual cortex in alternating columns called ocular dominance columns. Each column was dominated by input from each eye separately.
In some of their research, they sewed one eye of newborn kittens, closed to measure its impact on the development of vision. They discovered there was a critical period of development for vision. If kittens were deprived of input from one eye, the ocular dominance columns in the brain were taken over by the other eye. When the eye was opened after a few weeks, the kitten was blind in that eye. In other words, they discovered that sensory input was needed for normal visual development.
What do you think about sewing a kitten’s eye closed for research? Bear in mind, this research was helpful in preventing blindness and permanent vision damage in children born with eye problems. Would you conduct that research, even if it meant causing some harm to cats? Would you think the same way if you were the parent of a child with vision problems? What if you worked at an animal shelter?
Color VISION
Light is not made of different colors—we perceive color by detecting light of different wavelengths. Short wavelength light is perceived as blue, medium wavelengths as green and long wavelengths as red. By mixing these three primary wavelengths in different combinations we are able to match any color. The trichromatic theory of color vision states that we have three different types of cone, each of which is maximally sensitive to one of the three primary wavelengths. Any wavelength that we can see is coded by the relative activity of the three different cone types, which are commonly referred to as blue (short wavelength), green (medium wavelength), and red (long wavelength) cones (Figure 5.10).

You have probably heard of the term “color-blind”, most people who are “color-blind” can see colors, but they confuse certain ones because they look similar to them. The psychological term for this condition is color vision deficiency. The circles in Figure 5.11 are part of a common test used to see whether people are able to tell red from green.
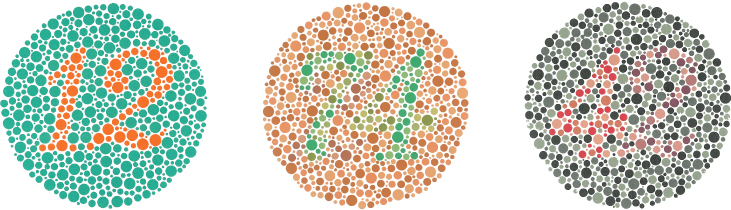
The most common color vision deficiency is confusion between reds and greens due to the absence or malfunction of the green or red cone types. This red-green color deficiency affects males more than females (Birch, 2012). Among males, it affects approximately 8% of European Whites, 5% of Asians, 4% of Africans, and less than 2% of indigenous Americans, Australians, and Polynesians (Birch, 2012). Only about 0.4% in females of European Caucasian descent have red-green color deficiency (Birch, 2012). Males are affected more than females because this is a sex-linked recessive genetic trait. Males inherit this gene from their mothers via the X chromosome. The Y chromosome in males is small and so lacks many of the genes that are present on the X chromosome (like the ones associated with color vision). So, if the recessive gene is present on the X chromosome in a male, it will be expressed—giving rise to red-green color deficiency. Typically, females are not affected because they are likely to also have a dominant normal color vision gene on their other X chromosome.
The trichromatic theory explains color vision at the level of the cones. The opponent process theory is a complementary theory, which explains how color is coded at the level of the ganglion cells and thalamus (Land, 1959; Kaiser, 1997). It states that color is coded in opponent pairs: black-white, yellow-blue, and green-red. The basic idea is that these cells in the visual system are excited by one of the opponent colors and inhibited by the other. So, a cell excited by wavelengths associated with green would be inhibited by wavelengths associated with red, and vice versa. Opponent processing helps to explain why we cannot experience greenish-reds or yellowish-blues as colors. The opponent process theory also explains our experience of negative afterimages. You have probably experienced an afterimage after looking directly at a lightbulb. You still see an image of the lightbulb (albeit of a different color) after you look away. The colors of the afterimage that we see can be predicted by the color pairings identified in the opponent-process theory. If we stare at a red color for a minute and then look at a white background, we will see green. You can test this concept using the flag in Figure 5.12.

Link to Learning
Watch this video about color perception to learn more.
Depth Perception
Our ability to perceive three-dimensional (3-D) space is known as depth perception. Our depth perception allows us to describe things as being in front, behind, above, below, or to the side of other things. We can also see real objects as three-dimensional (they have height, breadth and depth) rather than being flat, like a photo.
We use a variety of cues in a visual scene to perceive depth. Some of these are binocular cues, which means that they rely on the use of both eyes working together. Binocular depth perception relies on binocular disparity, in other words, each of our eyes receives a slightly different view of the world. You can experience binocular disparity by doing this simple exercise: Extend your arm fully and hold up one of your fingers. Now, close your left eye and line your finger up with an object in the distance – like a clock or a picture. Then open your left eye and close your right eye without moving your head. You will notice that your finger seems to shift position as you alternate between the two eyes. Our brain has cells that detect this disparity, so when our brain fuses the two different images from the eyes into a single object, we are able to see in 3-D.
A 3-D movie uses the same principle. It is created using specialized cameras equipped with two lenses that are separated by the same distance that we have between our two eyes. This allows for the production of two separate movies—one provides a view for the left eye and one for the right eye. The special glasses you wear allow the two slightly different images projected onto the screen to be seen separately by your left and your right eye, your brain then has to put them together. This can give the illusion that an animal, person, or object is coming right toward you.
Although we use binocular cues to experience depth in our 3-D world, we also use monocular (or 2-D) cues. These are also used by artists to give the perception of distance in pictures. We rely on monocular cues to make judgements about the relative position of objects in pictures and photographs. For example, in Figure 5.13, a monocular cue called linear perspective allows us to perceive a road stretching out into the distance. Linear perspective is where two parallel lines (like those on the sides of the road in Figure 5.13) converge to give the perception of depth. Some other monocular depth cues include the partial overlap of objects (the telegraph pole is covering the clouds – so we know the clouds are further away), relative size of objects (smaller clouds seem further away than larger ones), and relative height of the base of the objects (the bottom of the small white poles are closer than the bottom of the telegraph pole).
")
