Best Practices
10 Accessibility in STEM

Math and science materials can be particularly inaccessible because of their reliance on formulas, complex figures, and data. In this section, we focus first on the broadest approach to improving accessibility: presenting information in multiple ways. We also offer additional, more specific and more equitable recommendations for formula, figure, and data accessibility.
Who are you doing this for?
Who benefits?
Making formulas, figures, and data accessible is essential for users of screen readers such as students who are blind or have low vision.
In addition, the practice can benefit all STEM students learning how to read formulas, graphically presented content, and data.
The practice is also beneficial to students (among others) who:
- Are taking online, asynchronous courses (and therefore may never have heard how formulas, complex figures, or data are intended to be read aloud)
- Have limited Internet bandwidth
- Have ADHD
- Are dyslexic
- Listen to materials on commutes
- Have temporary compromised vision, such as accessing material in bright sunlight or while screen fatigued
What do you need to do?
At the very least, consider presenting STEM material in multiple ways: numerically, verbally, and graphically.
- Numerically
- Lay out equations line by line, step by step.
- In digital spaces, insert symbols using equation editors (see below) instead of copying images from elsewhere.
- In any digital format ensure you use specific symbols. For multiplication, for example, use the multiplication symbol [latex]\times[/latex] rather than the letter x or an asterisk (*). Avoid / for division, as assistive technology will read "21 forward slash 7." Instead, include the division symbol [latex]\div[/latex].
- Verbally
- Provide a video or audio recording in which you read aloud the material containing the equations, figures, or data.
- If demonstrating how to solve a problem, explain the steps and processes as you complete them, being mindful of students who can't see what you see. (In other words, avoid phrases such as "this equation here" or "on this line.")
- Graphically
- Use an accessible graphing tool such as Desmos.
- Include accessible data in table format.
- For a simple diagram or chart, alt text or long descriptions may suffice. (For practice in STEM-specific descriptions, visit the DIAGRAM Center's interactive training tool on describing images.)
While presenting STEM material in multiple ways can increase accessibility for a wide range of users, including many who are blind or have low vision, access to equations will still be less equitable for students using screen readers who won't have the opportunity to isolate particular elements of an equation. Consider the next-level steps below to improve accessibility for equations.
Equations
When considering full accessibility of equations, it helps to remember that everything we see on a computer is a display of the code behind it. An equation displayed on a website or an LMS page might look the same whether it is inserted as an image, coded as an equation, or input as typed text. But to anyone relying on a screen reader, an immersive reader, or limited Internet bandwidth, the way an equation is inserted will radically affect how it is represented, if at all.
For example, the three versions of the quadratic equation below look nearly identical, but the first one is a screen shot, the second is coded in LaTeX, and the third is coded in MathML. A student with low Internet bandwidth may see only the alt text of the first equation (which currently is set just to "the quadratic formula"—not helpful for a student who doesn't know the formula already). For those using assistive devices, the first equation will be read as "the quadratic formula" and the second equation may or may not be read like an equation, depending on the publishing platform. Only the third, coded in MathML, is designed to be read by assistive devices in a predictable way and that allows the user to isolate components, such as the term under the radical.
![]()
[latex]x=\frac{-b\pm\sqrt{b^2-4ac}}{2a}[/latex]
Improving Access to Equations Using Markup or Equation Editors
For online content, the best practice is to code equations in Math ML. As the University of Washington's DO-IT site explains, "MathML (Mathematical Markup Language) is an industry standard adopted by the World Wide Web Consortium (W3C) as the approved way of expressing math on the web. Like the more familiar HyperText Markup Language (HTML), which sets the standard for web browsers to display literary text, MathML is an international open standard for encoding math content. MathML is needed because HTML has no means of marking up mathematical expressions. Using MathML provides the highest level of accessibility to math within digital documents." Math ML is now supported in all major web browsers such as Chrome and Firefox.
Equation Editors
Most digital platforms, such as Pressbooks, Microsoft Word, and Learning Management Systems, provide equation editors that translate equations into a more screen-reader friendly format and even, as is the case with Pressbooks, Math ML (via MathJax). These equation editors are generally provided in the program's text editor, alongside more familiar options such as bulleted lists or tables. Microsoft Word and PowerPoint offers equation editors via the Insert menu.
Image with an alt tag
Another option is to create an image of an equation (or export it from an equation editor) and then insert the image into a document with an alt tag.
Note: Alt tags can be written in Nemeth MathSpeak for students who have learned that system.
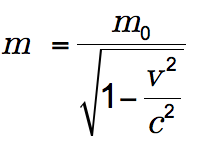
Example 1: An equation in HTML
View the alt tag
alt = "m equals begin fraction m sub 0 over begin square root 1 minus begin fraction v sup 2 over c sup 2 end fraction end square root end fraction"
LaTeX
LaTeX is a math markup language familiar to many in the science and math community. Unfortunately, it is not currently supported by some screen reader technologies. It is, however, fairly simple to convert LaTeX to an image or MathML in most equation editors.
At a BCcampus user-testing session, students indicated that it would be helpful to place an audio file of the formula or equation alongside each, allowing the user to hear exactly how the formula or equation should be interpreted.
Additional resources
Math accessibility at Portland Community College
In 2012, Portland Community College departments took a closer look at making math accessible to blind students. Read more about the math accessibility study or watch Math Accessibility at Portland Community College. (This video is an open educational resource.) Even over a decade old, the study reminds us that there is no single solution to the problem of accessibility, and a multi-layered approach, in true UDL fashion, is the best bet.
Advanced Tools
For the ultimate in STEM accessibility, consider investing the time in learning these tools:
- PreTeXt which allows authors to create accessible, HTML-native digital books. Visit the PreTeXt page and browse the gallery for inspiration. Then dive into the PreTeXt Guide to get started.
- MathCAT, a coding library that converts MathML to a range of assistive-technology formats. Visit the MathCAT GitHub repository to learn more including exploration of a demo of how the library can be used.
- LaTeX-OCR, a new ML tool that provides options for generating LaTeX from OCR scans and therefore can help with remediation projects. Visit the LaTeX-OCR GitHub repository to learn more.
Attributions
- "What do you need to do?," "Image with an Alt Tag," "LaTeX," and "Math Accessibility at Portland College" adapted from "Accessibility Toolkit—2nd Edition" by Amanda Coolidge, Sue Doner, Tara Robertson, and Josie Gray (a collaboration between BCcampus, Camosun College, and CAPER-BC) licensed under CC BY 4.0. Portions of the original chapter were derivatives of Equations: MathML, Images and LaTeX by Penn State. Penn State provided permission to the BC Campus authors to use the information under the licence of their toolkit.

