6 Brain and Body Development
Learning Objectives
After reading Chapter 6, you should be better equipped to:
- Describe newborn reflexes.
- Describe the growth of the brain during infancy and early childhood.
- Contrast development of the senses in newborns.
- Identify immunizations and diseases they help protect against.
- Compare gross and fine motor skills and give examples of each.
- Compare child meal patterns.
From Reflexes to Voluntary Movements
Reflexes
Reflexes are involuntary movements or actions. Some movements are spontaneous and occur as part of the baby’s normal activity, while other movements are responses to certain actions. Healthcare providers will often check reflexes to determine if the brain and nervous system are working well. While some reflexes occur only in specific periods of development, other reflexes will remain and change during the course of development. The following are some of the normal reflexes seen in newborn babies:[1]
- Rooting reflex – This reflex starts when the corner of the baby’s mouth is stroked or touched. The baby will turn his or her head and open his or her mouth to follow and root in the direction of the stroking. This helps the baby find the breast or bottle to start feeding. This reflex lasts about 4 months. [2]
- Sucking reflex– Rooting helps the baby get ready to suck. When the roof of the baby’s mouth is touched, the baby will start to suck. This reflex doesn’t start until about the 32nd week of pregnancy and is not fully developed until about 36 weeks. Premature babies may have a weak or immature sucking ability because of this. Because babies also have a hand-to-mouth reflex that goes with rooting and sucking, they may suck on their fingers or hands. [3]
- Moro reflex – The Moro reflex is often called a startle reflex. That’s because it usually occurs when a baby is startled by a loud sound or movement. In response to the sound, the baby throws back his or her head, extends out his or her arms and legs, cries, then pulls the arms and legs back in. A baby’s own cry can startle him or her and trigger this reflex. This reflex lasts until the baby is about 2 months old. [4]
- Stepping reflex – The stepping reflex prepares the baby to start walking independently. When the baby is held under the arms with their bare feet touching the ground, the newborn will make “stepping” movements with his or her legs. This generally disappears around the age of 2 months. [5]
- Babinski reflex – The function of the Babinski reflex is unknown, although it may have to do with walking. After stroking the bottom of the baby’s foot from toe to heel, the baby’s toes fan out and the foot pulls up and away toward the shin. This can last up until the end of the first year of life, though it often disappears around 8-9 months. At this point the reflex changes, and the toes curl down and the foot curls in response to the same stimulation. If the earlier Babinski reflex is found in an adult, it can indicate some form of brain damage.[6]
- Grasping reflex – Stroking the palm of a baby’s hand causes the baby to close his or her fingers in a grasp. The grasp reflex lasts until the baby is about 5 to 6 months old. A similar reflex in the toes lasts until 9 to 12 months.[7]
Test Yourself
Brain Development
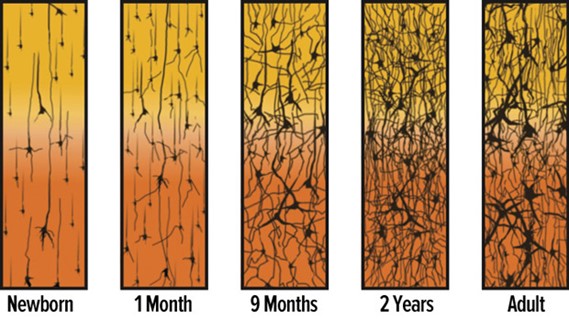
Some of the most dramatic physical change that occurs after birth is in the brain. We are born with most of the brain cells that we will ever have; that is, about 100 billion neurons whose function is to store and transmit information. While most of the brain’s neurons are present at birth, they are not fully mature. During the next several years dendrites, or branching extensions that collect information from other neurons, will undergo a period of exuberance. Because of this proliferation of dendrites, by age two a single neuron might have thousands of dendrites. Synaptogenesis, or the formation of connections between neurons, continues from the prenatal period forming thousands of new connections during infancy and toddlerhood. This period of rapid neural growth is referred to as synaptic blooming.
The blooming period of neural growth is then followed by a period of synaptic pruning, where neural connections are reduced thereby making those that are used much stronger. It is thought that pruning causes the brain to function more efficiently, allowing for mastery of more complex skills (Kolb & Whishaw, 2011). Experience will shape which of these connections are maintained and which of these are lost. Ultimately, about 40 percent of these connections will be lost (Webb, Monk, and Nelson, 2001). Blooming occurs during the first few years of life, and pruning continues through childhood and into adolescence in various areas of the brain.
Another major change occurring in the central nervous system is the development of myelin, a coating of fatty tissues around the axon of the neuron (Carlson, 2014). Myelin helps insulate the nerve cell and speed the rate of transmission of impulses from one cell to another. This enhances the building of neural pathways and improves coordination and control of movement and thought processes. The development of myelin continues into adolescence but is most dramatic during the first several years of life.
The Development of Brain Synapses[8]
The infant brain grows very fast. At birth the brain is about 250 grams (half a pound) and by one year it is already 750 grams (Eliot, 1999). Comparing to adult size, the newborn brain is approximately 33% of adult size at birth, and in just 90 days, it is already at 55% of adult size (Holland et al., 2014). Most of the neural activity is occurring in the cortex or the thin outer covering of the brain involved in voluntary activity and thinking. The cortex is divided into two hemispheres (left hemisphere and right hemisphere), and each hemisphere is divided into four lobes, each separated by folds known as fissures. If we look at the cortex starting at the front of the brain and moving over the top (see Figure 3.3), we see first the frontal lobe (behind the forehead), which is responsible primarily for thinking, planning, memory, and judgment. Following the frontal lobe is the parietal lobe, which extends from the middle to the back of the skull and which is responsible primarily for processing information about touch. Next is the occipital lobe, at the very back of the skull, which processes visual information. Finally, in front of the occipital lobe, between the ears, is the temporal lobe, which is responsible for hearing and language (Jarrett, 2015).[9]
Left and Right Hemispheres of the Human Brain
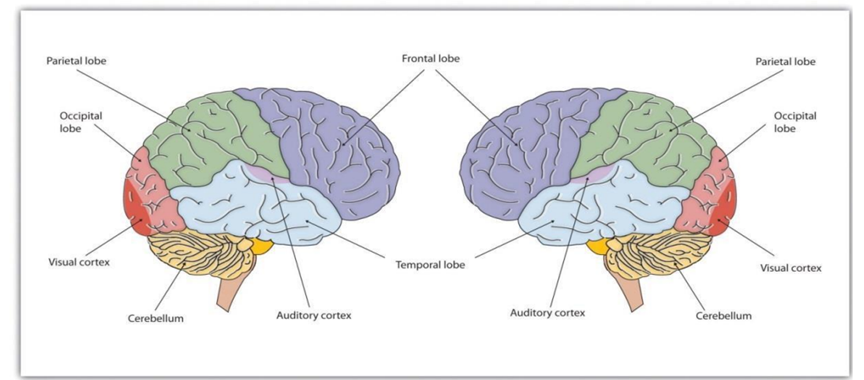
The brain is divided into two hemispheres (left and right), each of which has four lobes (temporal, frontal, occipital, and parietal). Furthermore, there are specific cortical areas that control different processes.[10]
Test Yourself
MRI Scans of the Human Brain[11]
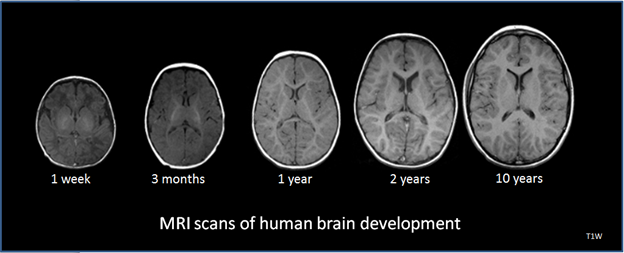
Although the brain grows rapidly during infancy, specific brain regions do not mature at the same rate. Primary motor areas develop earlier than primary sensory areas, and the prefrontal cortex, that is located behind the forehead, is the least developed (Giedd,2015). As the prefrontal cortex matures, the child is increasingly able to regulate or control emotions, to plan activities, strategize, and have better judgment. This is not fully accomplished in infancy and toddlerhood but continues throughout childhood.
Neuroplasticity refers to the brain’s ability to change, both physically and chemically, to enhance its adaptability to environmental change and compensate for injury. The control of some specific bodily functions, such as movement, vision, and hearing, is performed in specified areas of the cortex, and if these areas are damaged, the individual will likely lose the ability to perform the corresponding function. The brain’s neurons have a remarkable capacity to reorganize and extend themselves to carry out these particular functions in response to the needs of the organism, and to repair any damage. As a result, the brain constantly creates new neural communication routes and rewires existing ones. Both environmental experiences, such as stimulation and events within a person’s body, such as hormones and genes, affect the brain’s plasticity. So too does age. Adult brains demonstrate neuroplasticity, but they are influenced less extensively than those of infants (Kolb & Fantie, 1989; Kolb & Whishaw, 2011). [12]
The brain is about 75 percent its adult weight by three years of age. By age 6, it is at 95 percent its adult weight (Lenroot & Giedd, 2006). Myelination and the development of dendrites continue to occur in the cortex and as it does, we see a corresponding change in what the child is capable of doing. Greater development in the prefrontal cortex, the area of the brain behind the forehead that helps us to think, strategize, and control attention and emotion, makes it increasingly possible to inhibit emotional outbursts and understand how to play games. Understanding the game, thinking ahead, and coordinating movement improve with practice and myelination.
Growth in the Hemispheres and Corpus Callosum: Between ages 3 and 6, the left hemisphere of the brain grows dramatically. This side of the brain or hemisphere is typically involved in language skills. The right hemisphere continues to grow throughout early childhood and is involved in tasks that require spatial skills, such as recognizing shapes and patterns. The corpus callosum, a dense band of fibers that connects the two hemispheres of the brain, contains approximately 200 million nerve fibers that connect the hemispheres (Kolb & Whishaw, 2011). The corpus callosum is illustrated below.[13]
Corpus Callosum[14]
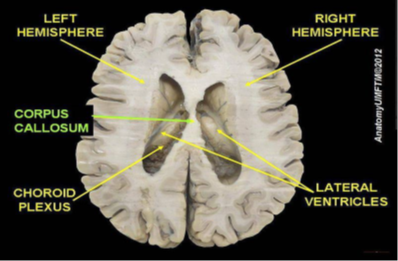
The corpus callosum is located a couple of inches below the longitudinal fissure, which runs the length of the brain and separates the two cerebral hemispheres (Garrett, 2015). Because the two hemispheres carry out different functions, they communicate with each other and integrate their activities through the corpus callosum. Additionally, because incoming information is directed toward one hemisphere, such as visual information from the left eye being directed to the right hemisphere, the corpus callosum shares this information with the other hemisphere.
The corpus callosum undergoes a growth spurt between ages 3 and 6, and this results in improved coordination between right and left hemisphere tasks. For example, in comparison to other individuals, children younger than 6 demonstrate difficulty coordinating an Etch A Sketch toy because their corpus callosum is not developed enough to integrate the movements of both hands (Kalat, 2016).
Two major brain growth spurts occur during middle/late childhood (Spreen, Riser, & Edgell, 1995). Between ages 6 and 8, significant improvements in fine motor skills and eye-hand coordination are noted. Then between 10 and 12 years of age, the frontal lobes become more developed and improvements in logic, planning, and memory are evident (van der Molen & Molenaar, 1994). Myelination is one factor responsible for these growths. From age 6 to 12, the nerve cells in the association areas of the brain, that is those areas where sensory, motor, and intellectual functioning connect, become almost completely myelinated (Johnson, 2005). This myelination contributes to increases in information processing speed and the child’s reaction time. The hippocampus, responsible for transferring information from the short-term to long-term memory, also show increases in myelination resulting in improvements in memory functioning (Rolls, 2000). Children in middle to late childhood are also better able to plan, coordinate activity using both left and right hemispheres of the brain, and to control emotional outbursts. Paying attention is also improved as the prefrontal cortex matures (Markant & Thomas, 2013).[15]
Changes in the brain between ages 6 and 8 also allow children to understand what others think of them and how to deal socially with the positive and negative consequences of that. Within this development period, children may struggle with mental health disorders or other health problems. As children are growing and becoming more capable, adults need to remember that children don’t grow in isolation. The development of their bodies isn’t separate from the changes that are occurring socially, emotionally, and cognitively. Awareness and understanding of their other developmental domains and needs will support the child during these changes.[16]
Test Yourself
Development of the Sensory Systems
Throughout much of history, the newborn was considered a passive, disorganized being who possessed minimal abilities. However, current research techniques have demonstrated just how developed the newborn is with especially organized sensory and perceptual abilities.
Vision
The womb is a dark environment void of visual stimulation. Consequently, vision is one of the most poorly developed senses at birth, and time is needed to build those neural pathways between the eyes and the brain (American Optometric Association [AOA], 2019). Newborns typically cannot see further than 8 to 10 inches away from their faces (AOA, 2019). An 8-week old’s vision is 20/300. This means an object 20 feet away from an infant has the same clarity as an object 300 feet away from an adult with normal vision. By 3-months visual acuity has sharpened to 20/200, which would allow them the see the letter E at the top of a standard eye chart (Hamer, 2016). As a result, the world looks blurry to young infants (Johnson & deHaan, 2015).
Why is visual acuity so poor in the infant? The fovea, which is the central field of vision in the retina and allows us to see sharp detail, is not fully developed at birth, and does not start to reach adult levels of development until 15 months (Li & Ding, 2017). Even by 45 months some of the sensory neurons (cones) of the fovea are still not fully grown. Can babies see color? Young infants can perceive color, but the colors need to be very pure forms of basic colors, such as vivid red or green rather than weaker pastel shades. Most studies report that babies can see the full spectrum of colors by five months of age (AOA, 2019).
Newborn infants prefer and orient to face-like stimuli more than they do other patterned stimuli (Farroni et al., 2005). They also prefer images of faces that are upright and not scrambled (Chien, 2011). Infants also quickly learn to distinguish the face of their mother from faces of other women (Bartrip, Morton, & De Schonen, 2001). When viewing a person’s face, one-month old’s fixate on the outer edges of the face rather than the eyes, nose, or mouth, and two-month old’s gaze more at the inner features, especially the eyes (Hainline, 1978).
Researchers have examined the development of attention and tracking in the visual system and have found the following for young infants:
- One-month-olds have difficulty disengaging their attention and can spend several minutes fixedly gazing at a stimulus (Johnson & deHaan, 2015).
- Aslin (1981) found that when tracking an object visually, the eye movements of newborns and one-month old’s are not smooth but saccadic, that is step-like jerky movements. Aslin also found their eye movements lag behind the object’s motion. This means young infants do not anticipate the trajectory of the object. By two months of age, their eye movements are becoming smoother, but they still lag behind the motion of the object and will not achieve this until about three to four months of age (Johnson & deHaan, 2015).
- Newborns also orient more to the visual field toward the side of the head, than to the visual field on either side of the nose (Lewis, Maurer, & Milewski, 1979). By two to three months, stimuli in both fields are now equally attended to (Johnson & deHaan, 2015).
Binocular vision, which requires input from both eyes, is evident around the third month and continues to develop during the first six months (Atkinson & Braddick, 2003). By six months infants can perceive depth perception in pictures as well (Sen, Yonas, & Knill, 2001). Infants who have experience crawling and exploring will pay greater attention to visual cues of depth and modify their actions accordingly (Berk, 2007).[17]
One of the first studies to investigate whether human infants could detect depth was conducted by Eleanor J. Gibson and Richard D. Walk in 1960. To test the ability to use depth, Gibson and Walk created an apparatus they called the Visual Cliff. This apparatus consisted of a ‘bridge’ either side of which was a sturdy glass platform. One side of this had a checkered pattern immediately under the glass (the ‘shallow side’). On the other side of the bridge was a ‘cliff’ – the checkered pattern was beneath a vertical drop.[18]
Gibson and Walk’s Visual Cliff
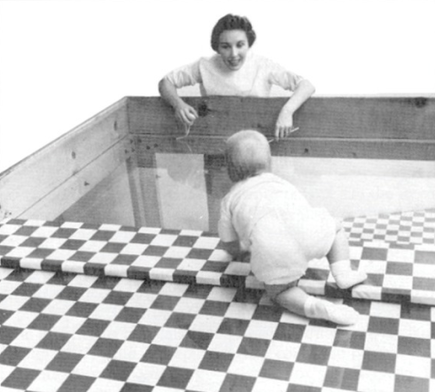
This mother is encouraging her child to crawl across the visual cliff. The child hesitates to move forward as they see the transparent surface.[19]
Gibson and Walk hypothesized that if the child had developed depth perception then they would perceive the “cliff” side of the apparatus as a drop-off and would not cross, even if their Mom was on the other side encouraging them to do so. Thirty-six infants between the ages of six to fourteen months were initially tested and the results showed that while 75% of the infants crawled to the Mom on the shallow side of the cliff, 92% of the babies refused to cross over to the “cliff” side.[20]
Vision Screening for Infants and Children
A vision screening, also called an eye test, is a brief exam that looks for potential vision problems and eye disorders. Vision screenings are often done by primary care providers as part of a child’s regular checkup. Sometimes screenings are given to children by school nurses.
Vision screening is not used to diagnose vision problems. If a problem is found on a vision screening, your child’s provider will refer you to an eye care specialist for diagnosis and treatment. This specialist will do a more thorough eye test. Many vision problems and disorders can be successfully treated with corrective lenses, minor surgery, or other therapies.
Vision screening is most often used to check for possible vision problems in children. The most common eye disorders in children include:[21]
- Strabismus: Six different muscles surround each eye and work “as a team.” This allows both eyes to focus on the same object. In someone with strabismus, these muscles do not work together. As a result, one eye looks at one object, while the other eye turns in a different direction and looks at another object. When this occurs, two different images are sent to the brain — one from each eye and this confuses the brain. In children, the brain may learn to ignore (suppress) the image from the weaker eye.
If the strabismus is not treated, the eye that the brain ignores will never see well. This loss of vision is called amblyopia. Another name for amblyopia is lazy eye. Sometimes lazy eye is present first, and it causes strabismus.[22]
Infant with Strabismus[23]

In most children with strabismus, the cause is unknown. In more than one half of these cases, the problem is present at or shortly after birth. This is called congenital strabismus.
- Amblyopia, also known as lazy eye. Children with amblyopia have blurry or reduced vision in one eye.[24] Treatment for amblyopia forces the child to use the eye with weaker vision. There are two common ways to do this. One is to have the child wear a patch over the good eye for several hours each day, over a number of weeks to months. The other is with eye drops that temporarily blur vision. Each day, the child gets a drop of a drug called atropine in the stronger eye. It is also sometimes necessary to treat the underlying cause. This could include glasses or surgery.[25]
Child with Amblyopia
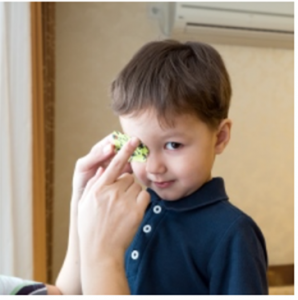
Patch being placed over young boy’s good eye, while the amblyopic eye remains uncovered. [26]
Both amblyopia and strabismus can be easily treated when found early.
Vision screening is also used to help find the following vision problems, which affect both children and adults:
- Nearsightedness (myopia), a condition that makes far away things look blurry
- Farsightedness (hyperopia), a condition that makes close-up things look blurry
- Astigmatism, a condition that makes both close-up and far-away things look blurry
A routine vision screening is not recommended for most healthy adults. But most adults are encouraged to get eye exams from an eye care specialist on a regular basis. However, children should be screened on a regular basis. The American Academy of Ophthalmology and the American Academy of Pediatrics (AAP) recommend the following vision screening schedule:
- Newborns: All new babies should be checked for eye infections or other disorders.
- 6 months: Eyes and vision should be checked during a regular well-baby visit.
- 1–4 years: Eyes and vision should be checked during routine visits.
- 5 years and older: Eyes and vision should be checked every year
Parents may need to get your child screened if he or she has symptoms of an eye disorder. For infants three months or older, symptoms include:
- Not being able to make steady eye contact
- Eyes that don’t look properly aligned
For older children, symptoms include:
- Eyes that don’t look properly lined up
- Squinting
- Closing or covering one eye
- Trouble reading and/or doing close-up work
- Complaints that things are blurry
- Blinking more than usual
- Watery eyes
- Droopy eyelids
- Redness in one or both eyes
- Sensitivity to light
There are several types of visual screening tests. They include:
- Distance vision test (Snellen Eye Chart). School-age children and adults are usually tested with a wall chart. The chart has several rows of letters. The letters on the top row are the biggest. The letters on the bottom are the smallest. You or your child will stand or sit 20 feet from the chart. He or she will be asked to cover one eye and read the letters, one row at a time. Each eye is tested separately.
- Distance vision test for preschoolers. For children too young to read, this test uses a wall chart similar to the one for older children and adults. But instead of rows of different letters, it only has the letter E in different positions. Your child will be asked to point in the same direction as the E. Some of these charts use the letter C, or use pictures, instead.
- Close-up vision test. For this test, you or your child will be given a small card with written text. The lines of text get smaller as you go farther down the card. You or your child will be asked to hold the card about 14 inches away from the face, and read aloud. Both eyes are tested at the same time. This test is often given to adults over 40, as close-up vision tends to get worse as you get older.
- Color blindness test. Children are given a card with colored numbers or symbols hidden in a background of multicolored dots. If they can read the numbers or symbols, it means they probably are not color blind.
If your infant is getting a vision screening, your provider will check for:
- Your baby’s ability to follow an object, such as a toy, with his or her eyes
- How his or her pupils (black center part of the eye) respond to a bright light
- To see if your baby blinks when a light is shone in the eye[27]
Test Yourself:
Hearing
The infant’s sense of hearing is very keen at birth, and the ability to hear is evidenced as soon as the seventh month of prenatal development. Newborns prefer their mother’s voices over another female when speaking the same material (DeCasper & Fifer, 1980). Additionally, they will register in utero specific information heard from their mother’s voice. DeCasper and Spence (1986) tested 16 infants (average age of 55.8 hours) whose mothers had previously read to them prenatally. The mothers read several passages to their fetuses, including the first 28 paragraphs of the Cat in the Hat, beginning when they were 7 months pregnant. The fetuses had been exposed to the stories an average of 67 times or 3.5 hours. When the experimental infants were tested, the target stories (previously heard) were more reinforcing than the novel story as measured by their rate of sucking. However, for control infants, the target stories were not more reinforcing than the novel story indicating that the experimental infants had heard them before.
An infant can distinguish between very similar sounds as early as one month after birth and can distinguish between a familiar and non-familiar voice even earlier. Infants are especially sensitive to the frequencies of sounds in human speech and prefer the exaggeration of infant-directed speech, which will be discussed later. Additionally, infants are innately ready to respond to the sounds of any language, but between six and nine months they show preference for listening to their native language (Jusczyk, Cutler, & Redanz, 1993). Their ability to distinguish the sounds that are not in the language around them diminishes rapidly (Cheour-Luhtanen, et al., 1995).[28]
Hearing Loss
Most children hear and listen to sounds at birth. They learn to talk by imitating the sounds they hear around them and the voices of their parents and caregivers. But that’s not true for all children. In fact, about two or three out of every 1,000 children in the United States are born with detectable hearing loss in one or both ears. More lose hearing later during childhood. Children who have hearing loss may not learn speech and language as well as children who can hear. For this reason, it’s important to detect deafness or hearing loss as early as possible.[29]
Hearing loss may be mild, moderate, severe, or profound. Profound hearing loss is what most people call deafness. Sometimes, hearing loss gets worse over time. Other times, it stays stable and does not get worse. Risk factors for infant hearing loss include:
- Family history of hearing loss
- Low birth weight
Hearing loss may occur when there is a problem in the outer or middle ear. These problems may slow or prevent sound waves from passing through. They include:
- Birth defects that cause changes in the structure of the ear canal or middle ear
- Buildup of ear wax
- Buildup of fluid behind the eardrum
- Injury to or rupture of the eardrum
- Objects stuck in the ear canal
- Scar on the eardrum from infections
Another type of hearing loss is due to a problem with the inner ear. It may occur when the tiny hair cells (nerve endings) that move sound through the ear are damaged. This type of hearing loss can be caused by:
- Exposure to certain toxic chemicals or medicines while in the womb or after birth
- Genetic disorders
- Infections the mother passes to her baby in the womb (such as toxoplasmosis, measles, or herpes)
- Infections that can damage the brain after birth, such as meningitis or measles
- Problems with the structure of the inner ear
- Tumors
Central hearing loss results from damage to the auditory nerve itself, or the brain pathways that lead to the nerve and is rare in infants and children. Symptoms of central hearing loss in infants and children include:
- A newborn baby with hearing loss may not startle when there is a loud noise nearby.
- Older infants, who should respond to familiar voices, may show no reaction when spoken to.
- Children should be using single words by 15 months, and simple 2-word sentences by age 2. If they do not reach these milestones, the cause may be hearing loss.
Some children may not be diagnosed with hearing loss until they are in school. This is true even if they were born with hearing loss. Inattention and falling behind in class work may be signs of undiagnosed hearing loss.
Hearing loss makes a baby unable to hear sounds below a certain level. A baby with normal hearing will hear sounds below that level. A health care provider will examine your child with an instrument called an otoscope to see inside the baby’s ear canal. The exam may show bone problems or signs of genetic changes that may cause hearing loss.
Two common tests are used to screen newborn infants for hearing loss:
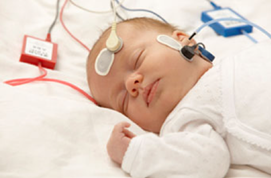
- Auditory brainstem response test (ABR). ABR is an objective test that allows an audiologist to get information about a baby’s hearing without needing a response from the child. This testing is typically done when a child has not passed their hearing screening test at birth or at their two-week follow-up screening.
The test is done by sending a sound into the child’s ear and measuring whether or not the cochlea, or hearing organ, passes the sound to the baby’s brain. Typically, a child is sleeping during the test and does not feel anything. The audiologist will put a few pads on the child’s forehead and near their ears to make the measurements while the sound goes into the child’s ears with soft earphones. After the testing is complete, the audiologist will talk through the results with parents/caregivers.[30]
ABR Testing[31]
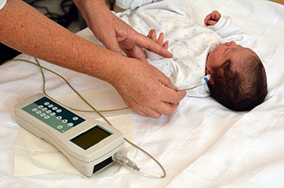
Otoacoustic emissions test (OAE). Tests whether some parts of the ear respond to sound. During this test, a soft earphone is inserted into your baby’s ear canal. It plays sounds and measures an “echo” response that occurs in ears with normal hearing. If there is no echo, your baby might have hearing loss. [32]
OAE Testing[33]
Older babies and young children can be taught to respond to sounds through play. These tests, known as visual response audiometry and play audiometry, can better determine the child’s range of hearing.
Currently, over 30 states in the United States require newborn hearing screenings. Treating hearing loss early can allow many infants to develop normal language skills without delay. In infants born with hearing loss, treatments should start as early as age 6 months and will depend on the bay’s overall health and the cause of hearing loss.[34]
Treatment may include:
- Hearing aids. Worn in or behind the ear, hearing aids help make sounds louder. Hearing aids can be used for different degrees of hearing loss in babies as young as 1 month. A pediatric audiologist who is experienced in treating infants and children can help you choose the best hearing aid and make sure that it fits securely and is properly adjusted. Read the NIDCD fact sheet Hearing Aids for more information.
- Cochlear implants. If your child won’t benefit from a hearing aid, your doctor may suggest a cochlear implant. This electronic device can provide a sense of sound to people who are profoundly deaf or hard-of-hearing. The device converts sounds into electrical signals and carries them past the nonworking part of the inner ear to the brain. Cochlear implants can be surgically placed in children as young as 12 months, or sometimes earlier.
- With training, children with cochlear implants can learn to recognize sounds and understand speech. Studies have also shown that eligible children who receive a cochlear implant before 18 months of age can develop language skills at a rate comparable to children with normal hearing, and many succeed in mainstream classrooms. Some doctors now recommend the use of two cochlear implants, one for each ear. An otolaryngologist who specializes in cochlear implants can help you decide if a cochlear implant is appropriate for your child. Read the NIDCD fact sheet Cochlear Implants for more information.
- Hearing Assistive devices. As your child grows, other devices may be useful. Some devices help children hear better in a classroom. Others amplify one-on-one conversations or make talking on the phone or watching TV and videos easier. Read the NIDCD fact sheet Assistive Devices for People with Hearing, Voice, Speech, or Language Disorders for more information.[35]
What Is A Cochlear Implant?
A cochlear implant is a small, complex electronic device that can help to provide a sense of sound to a person who is profoundly deaf or severely hard-of-hearing. The implant consists of an external portion that sits behind the ear and a second portion that is surgically placed under the skin (see figure below). An implant has the following parts:
- A microphone, which picks up sound from the environment.
- A speech processor, which selects and arranges sounds picked up by the microphone.
- A transmitter and receiver/stimulator, which receive signals from the speech processor and convert them into electric impulses.
- An electrode array, which is a group of electrodes that collects the impulses from the stimulator and sends them to different regions of the auditory nerve.
Illustration of Ear with Cochlear Implant
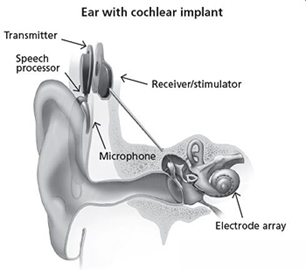
An implant does not restore normal hearing. Instead, it can give a deaf person a useful representation of sounds in the environment and help him or her to understand speech.
A cochlear implant is very different from a hearing aid. Hearing aids amplify sounds so they may be detected by damaged ears. Cochlear implants bypass damaged portions of the ear and directly stimulate the auditory nerve. Signals generated by the implant are sent by way of the auditory nerve to the brain, which recognizes the signals as sound. Hearing through a cochlear implant is different from normal hearing and takes time to learn or relearn. However, it allows many people to recognize warning signals, understand other sounds in the environment, and understand speech in person or over the telephone.
Children and adults who are deaf or severely hard-of-hearing can be fitted for cochlear implants. As of December 2012, approximately 324,200 registered devices have been implanted worldwide. In the United States, roughly 58,000 devices have been implanted in adults and 38,000 in children. (Estimates provided by the U.S. Food and Drug Administration [FDA], as reported by cochlear implant manufacturers.)
The FDA first approved cochlear implants in the mid-1980s to treat hearing loss in adults. Since 2000, cochlear implants have been FDA-approved for use in eligible children beginning at 12 months of age. For young children who are deaf or severely hard-of-hearing, using a cochlear implant while they are young exposes them to sounds during an optimal period to develop speech and language skills. Research has shown that when these children receive a cochlear implant followed by intensive therapy before they are 18 months old, they are better able to hear, comprehend sound and music, and speak than their peers who receive implants when they are older. Studies have also shown that eligible children who receive a cochlear implant before 18 months of age develop language skills at a rate comparable to children with normal hearing, and many succeed in mainstream classrooms.
Some adults who have lost all or most of their hearing later in life can also benefit from cochlear implants. They learn to associate the signals from the implant with sounds they remember, including speech, without requiring any visual cues such as those provided by lipreading or sign language.
Use of a cochlear implant requires both a surgical procedure and significant therapy to learn or relearn the sense of hearing. Not everyone performs at the same level with this device. The decision to receive an implant should involve discussions with medical specialists, including an experienced cochlear-implant surgeon. The process can be expensive. For example, a person’s health insurance may cover the expense, but not always. Some individuals may choose not to have a cochlear implant for a variety of personal reasons. Surgical implantations are almost always safe, although complications are a risk factor, just as with any kind of surgery. An additional consideration is learning to interpret the sounds created by an implant. This process takes time and practice. Speech-language pathologists and audiologists are frequently involved in this learning process. Prior to implantation, all of these factors need to be considered.
The National Institute on Deafness and Other Communication Disorders (NIDCD) supports research to enhance the benefits of cochlear implants. Scientists are exploring whether using a shortened electrode array, inserted into a portion of the cochlea, for example, can help individuals whose hearing loss is limited to the higher frequencies while preserving their hearing of lower frequencies. Researchers also are looking at the potential benefits of pairing a cochlear implant in one ear with either another cochlear implant or a hearing aid in the other ear.[36]
Learning to Communicate
Children who are deaf or hard-of-hearing can learn to communicate in several ways, including American Sign Language. Find out as much as you can about the communication choices and ask your health care team to refer you to experts if you want to know more. Because language development begins early, regardless of the communication mode you choose, you should engage with your child and begin intervention as soon as possible.
Here are the main options to help children with hearing loss express themselves and interact with others:
- Auditory-oral and auditory-verbal options combine natural hearing ability and hearing devices, such as hearing aids and cochlear implants, with other strategies to help children develop speech and English-language skills. Auditory-oral options use visual cues such as lipreading and sign language, while auditory-verbal options work to strengthen listening skills.
- Signed English is a system that uses signs to represent words or phrases in English. Signed English is designed to enhance the use of both spoken and written English.
- American Sign Language (ASL) is a language used by some children who are deaf and their families and communities. ASL consists of hand signs, body movements, and facial expressions. ASL has its own grammar, which is different from English. It has no written form. Read the NIDCD fact sheet American Sign Language for more information.
- Combined options use portions of the various methods listed above. For example, some deaf children who use auditory-oral options also learn sign language. Children who use ASL also learn to read and write in English. Combined options can expose children who are deaf or hard-of-hearing to many ways to communicate with others.
Like all children, children who are deaf or hard-of-hearing can develop strong academic, social, and emotional skills and succeed in school. [37]
Test Yourself
Touch and Pain
Immediately after birth, a newborn is sensitive to touch and temperature, and is also highly sensitive to pain, responding with crying and cardiovascular responses (Balaban & Reisenauer, 2013). Newborns who are circumcised, which is the surgical removal of the foreskin of the penis, without anesthesia experience pain as demonstrated by increased blood pressure, increased heart rate, decreased oxygen in the blood, and a surge of stress hormones (United States National Library of Medicine, 2016). Research has demonstrated that infants who were circumcised without anesthesia experienced more pain and fear during routine childhood vaccines. Fortunately, today many local pain killers are currently used during circumcision.
Taste and Smell
Studies of taste and smell demonstrate that babies respond with different facial expressions, suggesting that certain preferences are innate. Newborns can distinguish between sour, bitter, sweet, and salty flavors and show a preference for sweet flavors. Newborns also prefer the smell of their mothers. An infant only 6 days old is significantly more likely to turn toward its own mother’s breast pad than to the breast pad of another baby’s mother (Porter, Makin, Davis, & Christensen, 1992), and within hours of birth an infant also shows a preference for the face of its own mother (Bushnell, 2001; Bushnell, Sai, & Mullin, 1989).[38]
Physical Growth
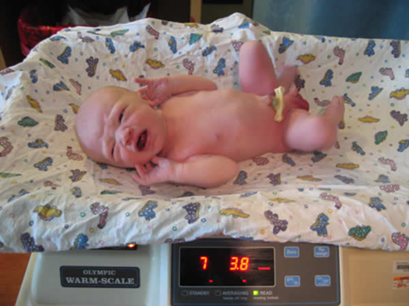
Overall Physical Growth: The average newborn in the United States weighs about 7.5 pounds (between 5 and 10 pounds) and is about 20 inches in length. For the first few days of life, infants typically lose about 5 percent of their body weight as they eliminate waste and get used to feeding. This often goes unnoticed by most parents but can be cause for concern for those who have a smaller infant. This weight loss is temporary, however, and is followed by a rapid period of growth. By the time an infant is 4 months old, it usually doubles in weight and by one year has tripled the birth weight. By age 2, the weight has quadrupled, so we can expect that a 2-year-old should weigh between 20 and 40 pounds. The average length at one year is about 29.5 inches and at two years it is around 34.4 inches (Bloem, 2007). [39]
A Newborn being Weighed.[40]
Growth is influenced by the two major trends, cephalocaudal development (from head to tail ) and proximodistal development (from the midline outward). These patterns suggest that growth starts from the head outward and from the midline out to the extremities, respectively. In early childhood, the average child grows 2½ inches and between 5 to 7 pounds a year. Girls are slightly smaller and lighter than boys. Infants’ body fat begins to decrease, and the head reaches a more proportional size given the changes in length. Of particular interest to this growth are the epiphyses (the rounded end of a long bone), or growth centers, where cartilage turns to bone. Looking at X-rays of these areas allows doctors to provide estimates of Skeletal Age, or judgment of the progression of physical development.
Structure of a Long Bone
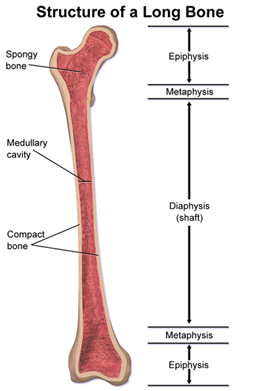
Structure of a long bone, with epiphysis labeled at top and bottom.[41]
Diagram Illustrating Bone Growth
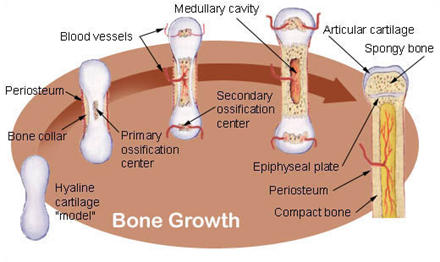
When cartilage growth ceases, usually in the early twenties, the epiphyseal plate completely ossifies so that only a thin epiphyseal line remains, and the bones can no longer grow in length. Bone growth is under the influence of growth hormone from the anterior pituitary gland and sex hormones from the ovaries and testes.[42]
Two hormones are very important to this growth process. The first is Human Growth Hormone (HGH) which influences all growth except that in the Central Nervous System (CNS). The hormone influencing growth in the CNS is called Thyroid Stimulating Hormone. Together these hormones influence the growth in early childhood.
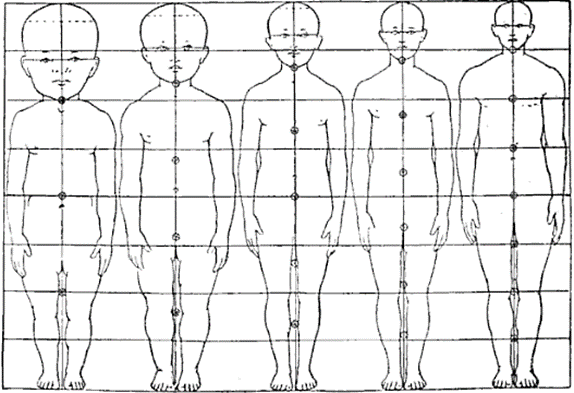
Another dramatic physical change that takes place in the first several years of life is the change in body proportions. The head initially makes up about 50 percent of our entire length when we are developing in the womb. At birth, the head makes up about 25 percent of our length, and by age 25 it comprises about 20 percent our length ((think about how much of your length would be head if the proportions were still the same!).[43]
Body Proportions from Infancy to Adulthood.[44]
Test Yourself
Motor Development
Infants and children grow and develop at a rapid pace during the first few years of life. The development of both gross and fine motor skills helps a child go from a completely dependent newborn to an independently functioning toddler in about a 3-year span.[45]
Motor development occurs in an orderly sequence as infants move from reflexive reactions (e.g., sucking and rooting) to more advanced motor functioning. As previously mentioned, development occurs according to the cephalocaudal and proximodistal principles. For instance, babies first learn to hold their heads up, then to sit with assistance, then to sit unassisted, followed later by crawling, pulling up, cruising or walking while holding on to something, and then unassisted walking (Eisenberg, Murkoff, & Hathaway, 1989). As motor skills develop, there are certain developmental milestones that young children should achieve. For each milestone there is an average age, as well as a range of ages in which the milestone should be reached. An example of a developmental milestone is a baby holding up its head. Babies on average are able to hold up their head at 6 weeks old, and 90% of babies achieve this between 3 weeks and 4 months old. On average, most babies sit alone at 7 months old. Sitting involves both coordination and muscle strength, and 90% of babies achieve this milestone between 5 and 9 months old. If the child is displaying delays on several milestones, that is reason for concern, and the parent or caregiver should discuss this with the child’s pediatrician. Developmental delays can be identified and addressed through early intervention.[46]
Fine motor skills focus on the muscles in our fingers, toes, and eyes, and enable coordination of small actions (e.g., grasping a toy, writing with a pencil, and using a spoon). Newborns cannot grasp objects voluntarily but do wave their arms toward objects of interest. At about 4 months of age, the infant is able to reach for an object, first with both arms and within a few weeks, with only one arm. At this age grasping an object involves the use of the fingers and palm, but no thumbs. This is known as the palmar grasp. The use of the thumb comes at about 9 months of age when the infant is able to grasp an object using the forefinger and thumb. Now the infant uses a pincer grasp, and this ability greatly enhances the ability to control and manipulate an object and infants take great delight in this newfound ability. They may spend hours picking up small objects from the floor and placing them in containers. By 9 months, an infant can also watch a moving object, reach for it as it approaches, and grab it.
Fine motor skills are also being refined in activities such as pouring water into a container, drawing, coloring, and using scissors. Some children’s songs promote fine motor skills as well (have you ever heard of the song “itsy, bitsy, spider”?). Mastering the fine art of cutting one’s own fingernails or tying shoes will take a lot of practice and maturation. Motor skills continue to develop in middle childhood-but for preschoolers, play that deliberately involves these skills is emphasized.
Gross motor skills focus on large muscle groups that control our head, torso, arms and legs and involve larger movements (e.g., balancing, running, and jumping). These skills begin to develop first. Examples include moving to bring the chin up when lying on the stomach, moving the chest up, and rocking back and forth on hands and knees. But it also includes exploring an object with one’s feet as many babies do as early as 8 weeks of age if seated in a carrier or other device that frees the hips. This may be easier than reaching for an object with the hands, which requires much more practice (Berk, 2007). Sometimes an infant will try to move toward an object while crawling and surprisingly move backward because of the greater amount of strength in the arms than in the legs.
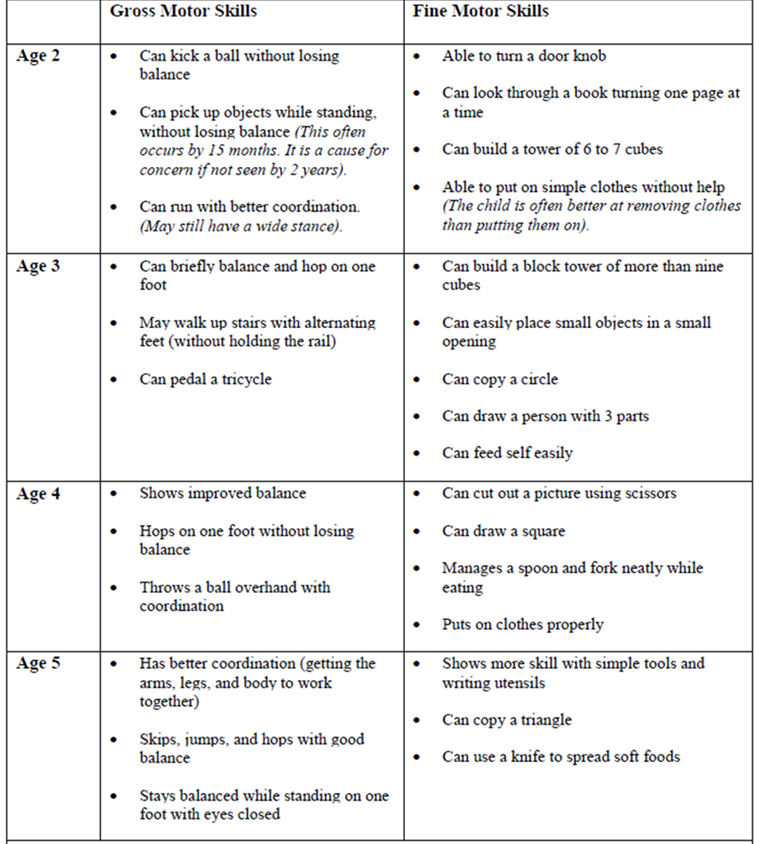
Early childhood is the time period when most children acquire the basic skills for locomotion, such as running, jumping, and skipping, and object control skills, such as throwing, catching, and kicking (Clark, 1994). Children continue to improve their gross motor skills as they run and jump. Fine motor skills are also being refined in activities, such as pouring water into a container, drawing, coloring, and buttoning coats and using scissors. The development of greater coordination of muscles groups and finer precision can be seen during this time period. Thus, average 2-year-olds may be able to run with slightly better coordination than they managed as a toddler, yet they would have difficulty peddling a tricycle, something the typical 3-year-old can do. We see similar changes in fine motor skills with 4-year-olds who no longer struggle to put on their clothes, something they may have had problems with two years earlier. Motor skills continue to develop into middle childhood, but for those in early childhood, play that deliberately involves these skills is emphasized. The table below shows the changes in gross and fine motor skills that can be found between the ages of 2 and 5. [47]
Changes in Gross and Fine Motor Skills in Early Childhood [48]
Test Yourself
Children’s Art
Children’s art highlights many developmental changes. Kellogg (1969) noted that children’s drawings underwent several transformations. Starting with about 20 different types of scribbles at age 2, children move on to experimenting with the placement of scribbles on a page. By age 3 they are using the basic structure of scribbles to create shapes and are beginning to combine these shapes to create more complex images. By 4 or 5 children are creating images that are more recognizable representations of the world. These changes are a function of improvement in motor skills, perceptual development, and cognitive understanding of the world (Cote & Golbeck, 2007).
The drawing below represents the features which are typically found in young children’s drawings of self and others. These types of images emerge in children’s drawing at about the age of 3 and have been observed in the drawings of young children around the world (Gernhardt, Rubeling & Keller, 2015), but there are cultural variations in the size, number of facial features, and emotional expressions displayed. Gernhardt et al. found that children from Western contexts (i.e., urban areas of Germany and Sweden) and urban educated non-Western contexts (i.e., urban areas of Turkey, Costa Rica and Estonia) drew larger images, with more facial detail and more positive emotional expressions, while those from non-Western rural contexts (i.e., rural areas of Cameroon and India) depicted themselves as smaller, with less facial details and a more neutral emotional expression. The authors suggest that cultural norms of non-Western traditionally rural cultures, which emphasize the social group rather than the individual, may be one of the factors for the smaller size of the figures compared to the larger figures from children in the Western cultures which emphasize the individual.[49]
Four-Year-Old’s Drawing [50]

From the ages of about 6 to 11 children begin to gain greater control over the movement of their bodies and begin to master many gross and fine motor skills that eluded the younger child. In addition, rates of growth generally slow. Typically, a child will gain about 5-7 pounds a year and grow about 2-3 inches per year (CDC, 2000). They also tend to slim down and gain muscle strength and lung capacity making it possible to engage in strenuous physical activity for long periods of time. The beginning of the growth spurt, which occurs prior to puberty, begins two years earlier for females than males. The mean age for the beginning of the growth spurt for girls is nine, while for boys it is eleven. Children of this age tend to sharpen their abilities to perform both gross motor skills, such as riding a bike, and fine motor skills, such as cutting their fingernails. In gross motor skills (involving large muscles) boys typically outperform girls, while with fine motor skills (small muscles) girls outperform the boys. These improvements in motor skills are related to brain growth and experience during this developmental period.[51]
Sports
Middle childhood seems to be a great time to introduce children to organized sports, and in fact, many parents do. Nearly 3 million children play soccer in the United States (United States Youth Soccer, 2012). This activity promises to help children build social skills, improve athletically and learn a sense of competition. However, it has been suggested that the emphasis on competition and athletic skill can be counterproductive and lead children to grow tired of the game and want to quit. In many respects, it appears that children’s activities are no longer children’s activities once adults become involved and approach the games as adults rather than children. The U. S. Soccer Federation recently advised coaches to reduce the amount of drilling engaged in during practice and to allow children to play more freely and to choose their own positions. The hope is that this will build on their love of the game and foster their natural talents.
Sports are important for children. Children’s participation in sports has been linked to:
- Higher levels of satisfaction with family and overall quality of life in children
- Improved physical and emotional development
- Better academic performance
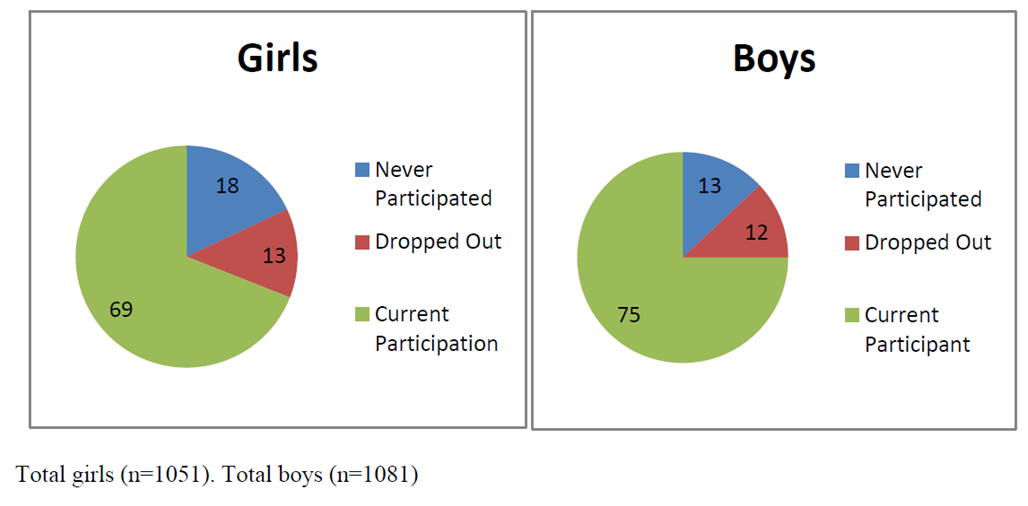
Yet, a study on children’s sports in the United States (Sabo & Veliz, 2008) has found that gender, poverty, location, ethnicity, and disability can limit opportunities to engage in sports. Girls were more likely to have never participated in any type of sport (see pie charts below). They also found that fathers may not be providing their daughters as much support as they do their sons. While boys rated their fathers as their biggest mentor who taught them the most about sports, girls rated coaches and physical education teachers as their key mentors. Sabo and Veliz also found that children in suburban neighborhoods had a much higher participation of sports than boys and girls living in rural or urban centers.[52]
Percentage of Girls versus Boys Who Participate in Sports [53]
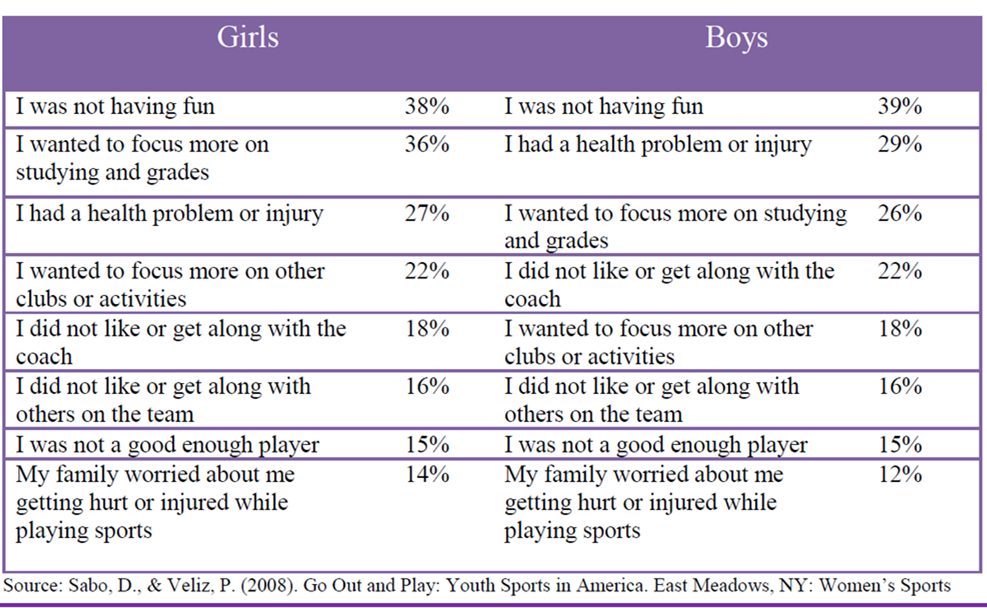
Finally, Sabo and Veliz asked children who had dropped out of organized sports why they left. For both girls and boys, the number one answer was that it was no longer any fun (see table below). According to the Sport Policy and Research Collaborative (SPARC) (2013), almost 1 in 3 children drop out of organized sports, and while there are many factors involved in the decisions to drop out, one suggestion has been the lack of training that coaches of children’s sports receive may be contributing to this attrition (Barnett, Smoll & Smith, 1992). Several studies have found that when coaches receive proper training, the drop-out rate is about 5% instead of the usual 30% (Fraser-Thomas, Côté, & Deakin, 2005; SPARC, 2013).[54]
Response to Sabo and Veliz (2008) Question, “Why did you drop out of playing sports?”[55]
Welcome to the world of esports: According to Discover Esports (2017), esports is a form of competition with the medium being video games. Players use computers or specific video game consoles to play video games against each other. In addition to playing themselves, children may just watch others play the video games. The recent SPARC (2016) report on the “State of Play” in the United States highlights a disturbing trend. One in four children between the ages of 5 and 16 rate playing computer games with their friends as a form of exercise. Over half of males and about 20% of females, aged 12-19, say they are fans of esports.
Since 2008 there has also been a downward trend in the number of sports children are engaged in, despite a body of research evidence that suggests that specializing in only one activity can increase the chances of injury, while playing multiple sports is protective (SPARC, 2016). A University of Wisconsin study found that 49% of athletes who specialized in a sport experienced an injury compared with 23% of those who played multiple sports (McGuine, 2016).
Physical Education: For many children, physical education in school is a key component in introducing children to sports. After years of schools cutting back on physical education programs, there has been a turnaround, prompted by concerns over childhood obesity and the related health issues. Despite these changes, currently only the state of Oregon and the District of Columbia meet PE guidelines of a minimum of 150 minutes per week of physical activity in elementary school and 225 minutes in middle school (SPARC, 2016).[56]
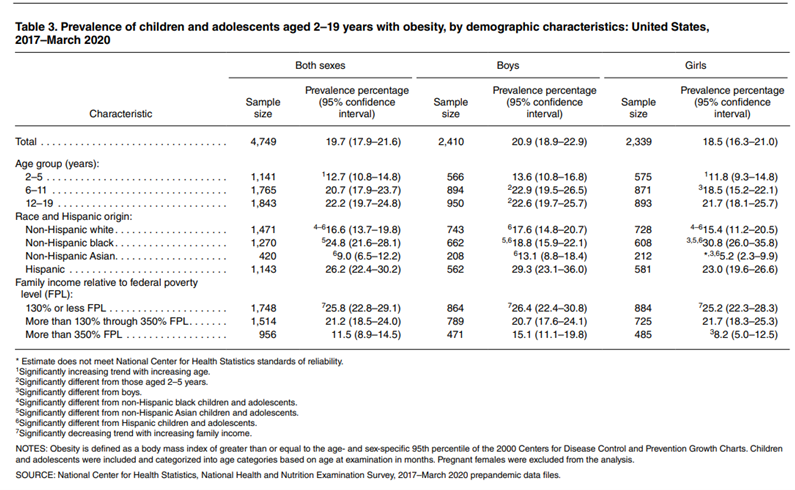
Childhood Obesity
The decreased participation in school physical education and youth sports is just one of many factors that has led to an increase in children being overweight or obese. The current measurement for determining excess weight is the Body Mass Index (BMI) which expresses the relationship of height to weight. According to the Centers for Disease Control and Prevention (CDC), children’s whose BMI is at or above the 85th percentile for their age are considered overweight, while children who are at or above the 95th percentile are considered obese (Lu, 2016). The data below show the most recent statistics published by the CDC across both gender and family income relative to the federal poverty level (FPL).[57]
Excess weight and obesity in children are associated with a variety of medical and cognitive conditions including high blood pressure, insulin resistance, inflammation, depression, and lower academic achievement (Lu, 2016). Being overweight has also been linked to impaired brain functioning, which includes deficits in executive functioning, working memory, mental flexibility, and decision making (Liang, Matheson, Kaye, & Boutelle, 2014). Children who ate more saturated fats performed worse on relational memory tasks, while eating a diet high in omega-3 fatty acids promoted relational memory skills (Davidson, 2014). Using animal studies Davidson et al. (2013) found that large amounts of processed sugars and saturated fat weakened the blood-brain barrier, especially in the hippocampus. This can make the brain more vulnerable to harmful substances that can impair its functioning. Another important executive functioning skill is controlling impulses and delaying gratification. Children who are overweight show less inhibitory control than normal weight children, which may make it more difficult for them to avoid unhealthy foods (Lu, 2016). Overall, being overweight as a child increases the risk for cognitive decline as one ages.
A growing concern is the lack of recognition from parents that children are overweight or obese. Katz (2015) referred to this as oblivobesity. Black, Park and Gregson (2015) found that parents in the United Kingdom (UK) only recognized their children as obese when they were above the 99.7th percentile while the official cut-off for obesity is at the 85th percentile. Oude Luttikhuis, Stolk, and Sauer (2010) surveyed 439 parents and found that 75% of parents of overweight children said the child had a normal weight and 50% of parents of obese children said the child had a normal weight. For these parents, overweight was considered normal and obesity was considered normal or a little heavy. Doolen, Alpert, and Miller (2009) reported on several studies from the United Kingdom, Australia, Italy, and the United States, and in all locations, parents were more likely to misperceive their children’s weight. Black et al. (2015) concluded that as the average weight of children rises, what parents consider normal also rises. Needless to say, if parents cannot identify if their children are overweight, they will not be able to intervene and assist their children with proper weight management.
An added concern is that the children themselves are not accurately identifying if they are overweight. In a United States sample of 8-15-year-olds, more than 80% of overweight boys and 70% of overweight girls misperceived their weight as normal (Sarafrazi, Hughes, & Borrud, 2014). Also noted was that as the socioeconomic status of the children rose, the frequency of these misconceptions decreased. It appeared that families with more resources were more conscious of what defines a healthy weight.
Children who are overweight tend to be rejected, ridiculed, teased and bullied by others (Stopbullying.gov, 2018). This can certainly be damaging to their self-image and popularity. In addition, obese children run the risk of suffering orthopedic problems such as knee injuries, and they have an increased risk of heart disease and stroke in adulthood (Lu, 2016). It is hard for a child who is obese to become a non-obese adult. In addition, the number of cases of pediatric diabetes has risen dramatically in recent years.
Behavioral interventions, including training children to overcome impulsive behavior, are being researched to help overweight children (Lu, 2016). Practicing inhibition has been shown to strengthen the ability to resist unhealthy foods. Parents can help their overweight children the best when they are warm and supportive without using shame or guilt. Parents can also act like the child’s frontal lobe until it is developed by helping them make correct food choices and praising their efforts (Liang, et al., 2014). Research also shows that exercise, especially aerobic exercise, can help improve cognitive functioning in overweight children (Lu, 2016). Parents should take caution against emphasizing diet alone to avoid the development of any obsession about dieting that can lead to eating disorders. Instead, increasing a child’s activity level is most helpful.
In 2018 the American Psychological Association (APA) developed a clinical practice guideline that recommends family-based, multicomponent behavioral interventions to treat obesity and overweight in children 2 to 18 (Weir, 2019). The guidelines recommend counseling on diet, physical activity and “teaching parents strategies for goal setting, problem-solving, monitoring children’s behaviors, and modeling positive parental behaviors,” (p. 32). Early research results have shown success using this model compared to controls. Because there is no quick fix for weight loss, the program recommends 26 contact hours with the family. Unfortunately, for many families cost, location, and time commitment make it difficult for them to receive the interventions. APA has recommended that behavioral treatment could be delivered in primary care offices to encourage greater participation. APA also recommend that schools and communities need to offer more nutritious meals to children and limit sodas and unhealthy foods.
A Look at School Lunches: Many children in the United States buy their lunches in the school cafeteria, so it might be worthwhile to look at the nutritional content of school lunches. You can obtain this information through your local school district’s website. An example of a school menu and nutritional analysis from a school district in north central Texas is a meal consisting of pasta alfredo, bread stick, peach cup, tomato soup, a brownie, and 2% milk and is in compliance with Federal Nutritional Guidelines of 108% calories, 24 % protein, 55 % carbohydrates, 27% fat, and 8% saturated fats, according to the website. Students may also purchase chips, cookies, or ice cream along with their meals. Many school districts rely on the sale of desert and other items in the lunchrooms to make additional revenues. Many children purchase these additional items and so our look at their nutritional intake should also take this into consideration.
Consider another menu from an elementary school in the state of Washington. This sample meal consists of chicken burger, tater tots, fruit and veggies and 1% or nonfat milk. This meal is also in compliance with Federal Nutrition Guidelines but has about 300 fewer calories, and children are not allowed to purchase additional deserts such as cookies or ice cream.[58]
- Used under permission as stated Stanford Children’s Health, Lucile Packard Children’s Hospital Stanford ↵
- Used under permission as stated Stanford Children’s Health, Lucile Packard Children’s Hospital Stanford ↵
- Used under permission as stated Stanford Children’s Health, Lucile Packard Children’s Hospital Stanford ↵
- Used under permission as stated Stanford Children’s Health, Lucile Packard Children’s Hospital Stanford ↵
- Boundless Psychology is licensed under CC BY SA 4.0 ↵
- Boundless Psychology is licensed under CC BY SA 4.0 ↵
- Used under permission as stated Stanford Children’s Health, Lucile Packard Children’s Hospital Stanford ↵
- Adapted from Corel, JL. The postnatal development of the human cerebral cortex. Cambridge, MA: Harvard University Press;1975 ↵
- Lifespan Development: A Psychological Perspective 2nd Edition by Martha Lally and Suzanne Valentine-French is licensed under CC BY-NC-SA 3.0 ↵
- Image by Martha Lally and Suzanne Valentine-French is licensed under CC BY-NC-SA 3.0 ↵
- Image is in the public domain ↵
- Lifespan Development: A Psychological Perspective 2nd Edition by Martha Lally and Suzanne Valentine-French is licensed under CC BY-NC-SA 3.0 ↵
- Lifespan Development: A Psychological Perspective 2nd Edition by Martha Lally and Suzanne Valentine-French is licensed under CC BY-NC-SA 3.0 ↵
- Image from Wikimedia is licensed under CC BY SA 3.0 ↵
- Lifespan Development: A Psychological Perspective 2nd Edition by Martha Lally and Suzanne Valentine-French is licensed under CC BY-NC-SA 3.0 ↵
- Children’s Development by Ana R. Leon is licensed under CC BY 4.0 (modified by Dawn Rymond and Maria Pagano); ↵
- Lifespan Development: A Psychological Perspective 2nd Edition by Martha Lally and Suzanne Valentine-French is licensed under CC BY-NC-SA 3.0 ↵
- Russel, J. (2020, July 27). Visual cliff experiment. Simply Psychology. Licensed under CC BY NC ND 3.0 ↵
- Image and text from NIH Visual Cliff Experiment from Wikimedia Commons. Licensed under CC BY SA 4.0 ↵
- Maria Pagano ↵
- Source: MedlinePlus, National Library of Medicine ↵
- Source MedlinePlus, National Library of Medicine ↵
- Image from MedlinePlus, National Library of Medicine ↵
- Source: MedlinePlus, National Library of Medicine ↵
- Source: MedlinePlus, National Library of Medicine ↵
- Source: MedlinePlus, National Library of Medicine ↵
- Source: MedlinePlus, National Library of Medicine ↵
- Lifespan Development: A Psychological Perspective 2nd Edition by Martha Lally and Suzanne Valentine-French is licensed under CC BY-NC-SA 3.0 ↵
- Public Domain: National Institute on Deafness and Other Communication Disorders (NIDCD) ↵
- From The Connection Blog, HEARTLAND Area Education Agency ↵
- Image from The Connection Blog, HEARTLAND Area Education Agency ↵
- Public Domain: National Institute on Deafness and Other Communication Disorders (NIDCD) ↵
- Public Domain: National Institute on Deafness and Other Communication Disorders (NIDCD) ↵
- Source: MedlinePlus, National Library of Medicine (modified by Maria Pagano) ↵
- Public Domain: National Institute on Deafness and Other Communication Disorders (NIDCD) ↵
- Public Domain National Institute on Deafness and Other Communication Disorders (NIDCD) ↵
- Public Domain: National Institute on Deafness and Other Communication Disorders (NIDCD) ↵
- Lifespan Development: A Psychological Perspective 2nd Edition by Martha Lally and Suzanne Valentine-French is licensed under CC BY-NC-SA 3.0 ↵
- Child Growth and Development: An Open Educational Resources Publication by College of the Canyons by Jennifer Paris, Antoinette Ricardo, and Dawn Richmond is licensed under CC BY 4.0 ↵
- Image by Trei Brundrett is licensed under CC BY-SA 2.0 ↵
- From Wikimedia. Blausen.com staff (2014). "Medical gallery of Blausen Medical 2014". WikiJournal of Medicine . DOI:10.15347/wjm/2014.010. ISSN 2002-4436. Licensed under CC BY 3.0 ↵
- SEER Training Modules, Bone Development and Growth. U. S. National Institutes of Health, National Cancer Institute. Public Domain ↵
- Child Growth and Development: An Open Educational Resources Publication by College of the Canyons by Jennifer Paris, Antoinette Ricardo, and Dawn Richmond is licensed under CC BY 4.0 ↵
- Image is in the public domain ↵
- Children’s Development by Ana R. Leon is licensed under CC BY 4.0 ↵
- Lifespan Development: A Psychological Perspective 2nd Edition by Martha Lally and Suzanne Valentine-French is licensed under CC BY-NC-SA 3.0 ↵
- Lifespan Development: A Psychological Perspective 2nd Edition by Martha Lally and Suzanne Valentine-French is licensed under CC BY-NC-SA 3.0 (modified by Maria Pagano) ↵
- Courtesy of MedlinePlus from the National Library of Medicine (NLM) ↵
- Lifespan Development: A Psychological Perspective 2nd Edition by Martha Lally and Suzanne Valentine-French is licensed under CC BY-NC-SA 3.0 (modified by Maria Pagano) ↵
- Image from Wikimdia Commons licensed under CC BY SA 2.5 ↵
- Lifespan Development: A Psychological Perspective 2nd Edition by Martha Lally and Suzanne Valentine-French is licensed under CC BY-NC-SA 3.0 (modified by Maria Pagano) ↵
- Lifespan Development: A Psychological Perspective 2nd Edition by Martha Lally and Suzanne Valentine-French is licensed under CC BY-NC-SA 3.0 ↵
- Lifespan Development: A Psychological Perspective 2nd Edition by Martha Lally and Suzanne Valentine-French is licensed under CC BY-NC-SA 3.0 ↵
- Lifespan Development: A Psychological Perspective 2nd Edition by Martha Lally and Suzanne Valentine-French is licensed under CC BY-NC-SA 3.0 ↵
- Lifespan Development: A Psychological Perspective 2nd Edition by Martha Lally and Suzanne Valentine-French is licensed under CC BY-NC-SA 3.0 ↵
- Lifespan Development: A Psychological Perspective 2nd Edition by Martha Lally and Suzanne Valentine-French is licensed under CC BY-NC-SA 3.0 ↵
- National Health and Nutrition Examination Survey 2017–March 2020 Prepandemic Data Files Development of Files and Prevalence Estimates for Selected Health Outcomes, Stierman, Bryan;Afful, Joseph;Carroll, Margaret D.;Chen, Te-Ching;Davy, Orlando;Fink, Steven;Fryar, Cheryl D.;Gu, Qiuping;Hales, Craig M.;Hughes, Jeffery P.;Ostchega, Yechiam;Storandt, Renee J.;Akinbami, Lara J.. National Center for Health Statistics (U.S.) Published Date : 06/14/2021. Licensed under Public Domain. ↵
- Lifespan Development: A Psychological Perspective 2nd Edition by Martha Lally and Suzanne Valentine-French is licensed under CC BY-NC-SA 3.0 ↵
newborn turns his/her head toward your hand if stroked on the cheek or mouth.
baby will begin to suck when the roof of the mouth is touched or stimulated.
a normal reflex for an infant when he or she is startled or feels like they are falling. The infant will have a startled look and the arms will fling out sideways with the palms up and the thumbs flexed.
a baby appears to take steps or dance when held upright with his or her feet touching a solid surface.
a reflex action in which the big toe remains extended or extends itself when the sole of the foot is stimulated, abnormal except in young infants.
Stroking the palm of a baby's hand causes the baby to close his or her fingers in a grasp.
a specialized cell transmitting nerve impulses.
a short branched extension of a nerve cell, along which impulses received from other cells at synapses are transmitted to the cell body.
the formation of synapses between neurons as axons and dendrites grow.
Blooming refers to when the brain produces more dendrites and synaptic connections than the brain uses.
the process by which extra neurons and synaptic connections are eliminated in order to increase the efficiency of neuronal transmissions.
the insulating layer around many axons that increases the speed of conduction of nerve impulses.
the outermost layer of the brain that is associated with our highest mental capabilities.
the left half of the cerebrum, the part of the brain concerned with sensation and perception, motor control, and higher level cognitive processes.
right hemisphere of the cerebrum is responsible for control of the left side of the body, and is the more artistic and creative side of the brain.
a cleft, groove, or indentation in a surface, especially any of the deep grooves in the cerebral cortex.
one of the four main lobes of each cerebral hemisphere of the brain, concerned with motor and higher order executive functions.
one of the four main subdivisions of each cerebral hemisphere; participate in somatosensory activities, such as the discrimination of size, shape, and texture of objects; visual activities, such as visually guided actions; and auditory activities, such as speech perception.
the most rearward subdivision of each cerebral hemisphere, which contains several visual areas that receive and process visual stimuli, and it is involved in basic and higher visual functions
one of the four main subdivisions of each cerebral hemisphere which contains the auditory projection and auditory association areas.
one of the principal brain areas involved in motor function. The role of the primary motor cortex is to generate neural impulses that control the execution of movement.
The primary sensory areas (visual, auditory, somatic sensory and gustatory areas) receive information from peripheral receptors with only a few synapses interposed.
The prefrontal cortex (PFC) plays a central role in cognitive control functions, and dopamine in the PFC modulates cognitive control, thereby influencing attention, impulse inhibition, prospective memory, and cognitive flexibility.
the ability of the brain to form and reorganize synaptic connections, especially in response to learning or experience or following injury.
bundle of nerve fibers that connects the left and right hemispheres of the brain.
a deep groove that marks the division between the left and right cerebral hemispheres of the brain.
brain structure located deep in the temporal lobe which plays a major role in learning and memory.
a small depression in the central portion of the retina in which retinal cone cells are most concentrated and an image is focused most clearly
the light-sensitive inner surface of the eye
receptor cells that help us see fine details of things and tend to help us see in situations where there is light or daylight.
a small rapid jerky movement of the eye especially as it jumps from fixation on one point to another
ability to converge information from both eyes that permits viewing of the surroundings in three dimensions.
the ability to see things in three dimensions (including length, width and depth), and to judge how far away an object is
an apparent, but not actual drop from one surface to another, originally created to test babies' depth perception.
problems with the control of eye movement and cannot keep normal ocular alignment (eye position); Strabismus can be categorized by the direction of the turned or misaligned eye: Inward turning (esotropia) Outward turning (exotropia) Upward turning (hypertropia)
also called lazy eye; reduced vision in one eye caused by abnormal visual development early in life. The weaker — or lazy — eye often wanders inward or outward.
same as amblyopia; reduced vision in one eye caused by abnormal visual development early in life. The weaker — or lazy — eye often wanders inward or outward.
medicine used as a muscle relaxant to dilate the pupil of the eye.
also known as myopia; vision condition in which you can see objects near to you clearly, but objects farther away are blurry
also known as nearsightedness; vision condition in which you can see objects near to you clearly, but objects farther away are blurry
also known as hyperopia; vision condition in which you can see distant objects clearly, but objects nearby may be blurry
also known as hyperopia; vision condition in which you can see distant objects clearly, but objects nearby may be blurry
a defect in the eye or in a lens caused by a deviation from spherical curvature, which results in distorted images, as light rays are prevented from meeting at a common focus.
used to determine the smallest letters you can read on a standardized chart (Snellen chart) or a card held 20 feet (6 meters) away.
also called distance vision test; chart used to measure visual acuity by determining the level of visual detail that a person can discriminate.
similar to a Snellen Chart used for adults except the images are pictures or the the letter "E" (Tumbling E's) in various positions (left, right, up and down).
your child will be given a small card with written text. The lines of text get smaller as you go farther down the card. You or your child will be asked to hold the card about 14 inches away from the face, and read aloud. Both eyes are tested at the same time.
Your eye doctor will ask you to look at an image made up of colored dots with a differently colored number or shape in the middle. If the shape blends into the background and you can’t see it, you may have a type of color blindness.
an instrument designed for visual examination of the eardrum and the passage of the outer ear, typically having a light and a set of lenses.
An audiologist places small earphones in the child's ears and soft electrodes (small sensor stickers) near the ears and on the forehead. Clicking sounds and tones go through the earphones, and electrodes measure how the hearing nerves and brain respond to the sounds.
measures hair cell function in the inner ear. An emission refers to the sound generated within the normal cochlea of the ear in response to stimulation.
a small device that fits in or on the ear, worn by a partially deaf person to amplify sound.
an electronic device that stimulates the auditory nerve through electrodes placed in the cochlea of the inner ear, allowing some severely deaf people to perceive sounds.
devices that can be used along with your hearing aids to enhance the listening experience and provide extra hearing assistance in challenging listening situations.
a visually perceived language based on a naturally evolved system of articulated hand gestures and their placement relative to the body, along with non-manual markers such as facial expressions, head movements, shoulder raises, mouth morphemes, and movements of the body.
The Auditory/Oral (A/O) approach teaches infants and young children to use hearing and speech to develop spoken language for communication and learning. Children typically attend a pre-school or early elementary program taught by teachers and therapists with A/O and child development training and experience.
When communicating with the hearing impaired, both American Sign Language (ASL) and Signed English (SE) are used. The basic signs for words are the same; however, with Signed English (SE) a sign is executed for every word in a sentence whereas American Sign Language seeks to convey a concept.
the general pattern of physical and motoric development followed from infancy into toddlerhood and even early childhood whereby development follows a head-to-toe progression.
the general tendency for the development of motor skills to start at the center of an organism and radiate outwards from there.
a part or process of a bone that ossifies separately and later becomes ankylosed (stiffened) to the main part of the bone
the main type of connective tissue seen throughout the body. It serves a variety of structural and functional purposes and exists in different types throughout our joints, bones, spine, lungs, ears and nose.
a thin layer of cartilage that lies between the epiphyses and metaphyses, and is where the growth of long bones takes place.
turn into bone or bony tissue.
the line marking the site of an epiphyseal plate that has has stopped growing and become ossified.
the front lobe of your pituitary gland, which is a small, pea-sized gland located at the base of your brain below your hypothalamus.
peptide hormone secreted by the anterior lobe of the pituitary gland. It stimulates the growth of essentially all tissues of the body, including bone.
the complex of nerve tissues that controls the activities of the body. In vertebrates it comprises the brain and spinal cord.
A hormone produced by the pituitary gland. Thyroid-stimulating hormone stimulates the release of thyroid hormone from thyroglobulin. It also stimulates the growth of thyroid follicular cells.
the stage between crawling or 'bottom shuffling' and walking independently. A baby is 'cruising' when they walk holding onto furniture, like a sofa or coffee table.
activities in which you use the small muscles in your hands and wrists to make precise movements.
foundational skills that involve bigger movements using large muscle groups – arms, legs, feet, and trunks – to move the body.
children who are at or above the 95th percentile.
also referred to as BMI. A person's weight in pounds divided by the square of height in feet.
children’s whose BMI is at or above the 85th percentile for their age
A measure of income issued every year by the Department of Health and Human Services (HHS). The FPL is based on family size and income, and the higher the percentage, the more income a family has, and the lower the percentage the less income a family has.
a type of fat containing a high proportion of fatty acid molecules without double bonds, considered to be less healthy in the diet than unsaturated fat.
parents' inability to identify that their children are overweight.
