2 Research Methods
Learning Objectives
After reading Chapter 2, you should be better equipped to
- Describe the scientific method and explain how it is used to study development.
- Explain the differences between qualitative and quantitative approaches to research methods.
- Explain the differences between descriptive and experimental designs.
- Understand when and how to use different research methodologies and the strengths and limitations of each methodology.
- Explain the types of research methodologies that are specific to conducting research in developmental psychology.
- Describe when and how to use preferential looking designs and the different habituations designs.
- Understand the protections used when conducting research with vulnerable populations like infants and children.
Knowing What We Know
Scientific research is a critical tool for successfully navigating our complex world. Without it, we would be forced to rely solely on intuition, other people’s authority, and blind luck. While many of us feel confident in our abilities to decipher and interact with the world around us, history is filled with examples of how very wrong we can be when we fail to recognize the need for evidence in supporting claims. For example, even today, some individuals believe that newborn infants can only see the colors black and white. However, Bower (1966)[1] demonstrated that while limited, newborn infants do have the ability to see color.
The goal of all scientists is to better understand the world around them. Psychologists focus their attention on understanding behavior, as well as the cognitive (mental) and physiological (body) processes that underlie behavior. In contrast to other methods that people use to understand the behavior of others, such as intuition and personal experience, the hallmark of scientific research is that there is evidence to support a claim. Scientific knowledge is empirical: It is grounded in objective, tangible evidence that can be observed time and time again, regardless of who is observing.
While behavior is observable, the mind is not. If someone is crying, we can see behavior. However, the reason for the behavior is more difficult to determine. Is the person crying due to being sad, in pain, or happy? Sometimes we can learn the reason for someone’s behavior by simply asking a question, like “Why are you crying?” However, there are situations in which an individual is either uncomfortable or unwilling to answer the question honestly or is incapable of answering. For example, infants would not be able to explain why they are crying. In such circumstances, the psychologist must be creative in finding ways to better understand behavior.
Scientific knowledge is advanced through a process known as the scientific method. Basically, ideas (in the form of theories and hypotheses are tested against the real world (in the form of empirical observations, and those empirical observations lead to more ideas that are tested against the real world, and so on.
The basic steps in the scientific method are:
- Observe a natural phenomenon and define a question about it
- Make a hypothesis, or potential solution to the question
- Test the hypothesis
- If the hypothesis is true, find more evidence or find counter-evidence
- If the hypothesis is false, create a new hypothesis or try again
- Draw conclusions and repeat–the scientific method is never-ending, and no result is ever considered perfect
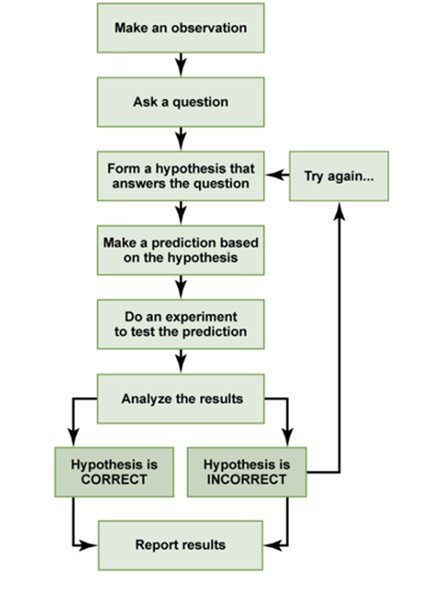
In order to ask an important question that may improve our understanding of the world, a researcher must first observe natural phenomena. By making observations, a researcher can define a useful question. After finding a question to answer, the researcher can then make a prediction in the form of a hypothesis about what he or she thinks the answer will be. This prediction is usually a statement about the relationship between two or more variables. After making a hypothesis, the researcher will then design an experiment to test his or her hypothesis and evaluate the data gathered. These data will either support or refute the hypothesis. Based on the conclusions drawn from the data, the researcher will then find more evidence to support the hypothesis, look for counterevidence to further strengthen the hypothesis, revise the hypothesis and create a new experiment, or continue to incorporate the information gathered to answer the research question.
Flowchart Outlining the Steps of the Scientific Method
The Basic Principles of the Scientific Method
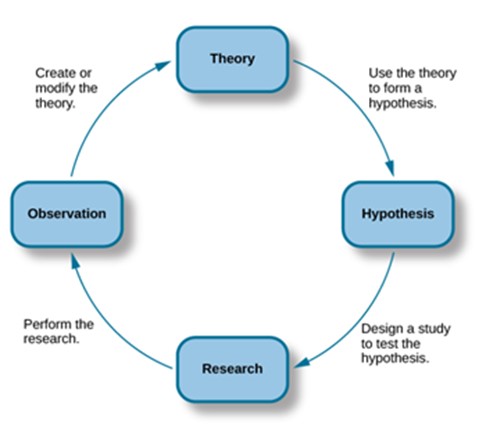
Two key concepts in the scientific approach are theory and hypothesis. A theory is a well-developed set of ideas that propose an explanation for observed phenomena that can be used to make predictions about future observations. A hypothesis is a testable prediction that is arrived at logically from a theory. It is often worded as an if-then statement (e.g., if I study all night, I will get a passing grade on the test). The hypothesis is extremely important because it bridges the gap between the realm of ideas and the real world. As specific hypotheses are tested, theories are modified and refined to reflect and incorporate the result of these tests.
The Relationship Between Observation, Theory, Hypothesis and Research
Applying the Scientific Method
To see how this process works, let’s consider a specific theory and a hypothesis that might be generated from that theory. The James-Lange theory of emotion asserts that emotional experience relies on the physiological arousal associated with the emotional state. If you walked out of your home and discovered a very aggressive snake waiting on your doorstep, your heart would begin to race and your stomach would churn. According to the James-Lange theory, these physiological changes would result in your feeling of fear. A hypothesis that could be derived from this theory might be that a person who is unaware of the physiological arousal that the sight of the snake elicits will not feel fear.
Remember that a good scientific hypothesis is falsifiable, or capable of being shown to be incorrect. Recall from Chapter 1 that Sigmund Freud had lots of interesting ideas to explain various human behaviors. However, a major criticism of Freud’s theories is that many of his ideas are not falsifiable; for example, it is impossible to imagine empirical observations that would disprove the existence of the id, the ego, and the superego—the three elements of personality described in Freud’s theories. Despite this, Freud’s theories are widely taught in introductory psychology texts because of their historical significance for personality psychology and psychotherapy, and these remain the root of all modern forms of therapy.
Why the Scientific Method Is Important for Psychology
The use of the scientific method is one of the main features that separates modern psychology from earlier philosophical inquiries about the mind. Compared to chemistry, physics, and other “natural sciences,” psychology has long been considered one of the “social sciences” because of the subjective nature of the things it seeks to study. Many of the concepts that psychologists are interested in—such as aspects of the human mind, behavior, and emotions—are subjective and cannot be directly measured. Psychologists often rely instead on behavioral observations and self-reported data, which are considered by some to be illegitimate or lacking in methodological rigor. Applying the scientific method to psychology, therefore, helps to standardize the approach to understanding its very different types of information.
The scientific method allows psychological data to be replicated and confirmed in many instances, under different circumstances, and by a variety of researchers. Through replication of experiments, new generations of psychologists can reduce errors and broaden the applicability of theories. It also allows theories to be tested and validated instead of simply being conjectures that could never be verified or falsified. All of this allows psychologists to gain a stronger understanding of how the human mind works.
Scientific articles published in journals and psychology papers written in the style of the American Psychological Association (i.e., in “APA style”) are structured around the scientific method. These papers include an Introduction, which introduces the background information and outlines the hypotheses; a Methods section, which outlines the specifics of how the experiment was conducted to test the hypothesis; a Results section, which includes the statistics that tested the hypothesis and state whether it was supported or not supported, and a Discussion and Conclusion, which state the implications of finding support for, or no support for, the hypothesis. Writing articles and papers that adhere to the scientific method makes it easy for future researchers to repeat the study and attempt to replicate the results.[2]
General Research Methodologies: Qualitative and Quantitative Research Methods
Qualitative methods of research involve using a more open, evolving approach to finding out about the world. There is less emphasis on quantifying what is known and more emphasis on tapping into the experiences, assumptions, and meanings subjects give to their situations. Qualitative methods can be used to explore an area about which little is known or to get a fresh look at a situation that has been studied before. The use of narratives in which the researcher tries to find out what is going on by using the subjects’ own words is one approach. Qualitative methods are used in anthropology, education, nursing, and other areas where the researcher wishes to be led by the participants into seeing what they deem as important.
The researcher begins with a broad interest and gains entrance into a setting in which to explore. Information is gathered using a variety of techniques such as observation, documenting the physical space and surroundings of that setting, recording interviews, etc. After gathering general information, the researcher may decide to focus more closely on specific research questions. Patterns may become apparent as the researcher revisits their field notes and spends more time in a setting. These prompt the researcher to explore new ideas until they feel they reach a point of saturation, or a feeling that they’ve thoroughly explored the situation. Patterns and answers to research questions are noted in a report of the findings.
Researchers who use qualitative methods might take the following steps when conducting research:
- Begin with a broad area of interest
- Gain entrance into a group to be researched
- Gather field notes about the setting, the people, the structure, the activities or other areas of interest
- Ask open ended, broad “grand tour” types of questions when interviewing subjects
- Modify research questions as study continues
- Note patterns or consistencies
- Explore new areas deemed important by the people being observed
- Report findings
In this type of research, theoretical ideas are “grounded” in the experiences of the participants. The researcher is the student and the people in the setting are the teachers as they inform the researcher of their world (Glazer & Strauss, 1967). Researchers are to be aware of their own biases and assumptions, acknowledge them and bracket them in efforts to keep them from limiting accuracy in reporting. Sometimes qualitative studies are used initially to explore a topic and more quantitative studies are used to test or explain what was first described.
Quantitative methods involve beginning with a research question, reviewing the literature to see what others have found in their research of the topic, determining specifically what aspect of the topic to explore in your research and determining the most appropriate method to use for your purposes, conducting the study, which means finding your sample, administering your survey or conducting your experiments, interpreting the results by analyzing your data, drawing conclusions about what you have found, and finally sharing your findings with others in the scientific community by publishing your research.
Researchers using quantitative methods typically take the following steps when conducting research:
- Determining a research question
- Reviewing previous studies addressing the topic in question (known as a literature review)
- Determining a method of gathering information
- Conducting the study
- Interpreting results
- Drawing conclusions; stating limitations of the study and suggestions for future research
- Making your findings available to others (both to share information and to have your work scrutinized by others)
This model of scientific investigation presents research as a linear process guided by a specific research question or hypothesis, and it typically involves quantifying or using statistics to understand and report what has been studied. Many academic journals publish reports on studies conducted in this manner and a good way to become more familiar with these steps is to look at journal articles which will be written in sections that follow these 7 steps.[3]
Specific Research Methodologies
A research design is the specific method a researcher uses to collect, analyze, and interpret data. Psychologists use three major types of research designs in their research, and each provides an essential avenue for scientific investigation. Descriptive or qualitative research is research that describes what is occurring at a point in time. Correlational research is research designed to discover relationships among variables and to allow the prediction of future events from present knowledge. Experimental research is research in which a researcher manipulates one or more variables to see their effects. Each of the three research designs varies according to its strengths and limitations.[3]
Each of these research methods has unique strengths and weaknesses, and each method may only be appropriate for certain types of research questions. For example, studies that rely primarily on observation produce incredible amounts of information, but the ability to apply this information to the larger population is somewhat limited because of small sample sizes. Survey research, on the other hand, allows researchers to easily collect data from relatively large samples. While this allows for results to be generalized to the larger population more easily, the information that can be collected on any given survey is somewhat limited and subject to problems associated with any type of self-reported data. Some researchers conduct archival research by using existing records. While this can be a fairly inexpensive way to collect data that can provide insight into a number of research questions, researchers using this approach have no control on how or what kind of data was collected.
Correlational research can find a relationship between two variables, but the only way a researcher can claim that the relationship between the variables is cause and effect is to perform an experiment. In experimental research, which will be discussed later in the text, there is a tremendous amount of control over variables of interest. While this is a powerful approach, experiments are often conducted in very artificial settings. This calls into question the validity of experimental findings with regard to how they would apply in real-world settings. In addition, many of the questions that psychologists would like to answer cannot be pursued through experimental research because of ethical concerns.
Descriptive or Qualitative Research
Descriptive or qualitative research methods include the case study, naturalistic observation/observational research, surveys, interviews, psychophysiological assessments, and secondary/content analysis or archival research.
Case Study Methodology
In 2011, the New York Times published a feature story on Krista and Tatiana Hogan, Canadian twin girls. These particular twins are unique because Krista and Tatiana are conjoined twins, connected at the head. There is evidence that the two girls are connected in a part of the brain called the thalamus, which is a major sensory relay center. Most incoming sensory information is sent through the thalamus before reaching higher regions of the cerebral cortex for processing.
The implications of this potential connection mean that it might be possible for one twin to experience the sensations of the other twin. For instance, if Krista is watching a particularly funny television program, Tatiana might smile or laugh even if she is not watching the program. This particular possibility has piqued the interest of many neuroscientists who seek to understand how the brain uses sensory information.
These twins represent an enormous resource in the study of the brain, and since their condition is very rare, it is likely that as long as their family agrees, scientists will follow these girls very closely throughout their lives to gain as much information as possible (Dominus, 2011).
In observational research, scientists are conducting a clinical or case study when they focus on one person or just a few individuals. Indeed, some scientists spend their entire careers studying just 10–20 individuals. Why would they do this? Obviously, when they focus their attention on a very small number of people, they can gain a tremendous amount of insight into those cases. The richness of information that is collected in clinical or case studies is unmatched by any other single research method. This allows the researcher to have a very deep understanding of the individuals and the particular phenomenon being studied.
If clinical or case studies provide so much information, why are they not more frequent among researchers? As it turns out, the major benefit of this particular approach is also a weakness. As mentioned earlier, this approach is often used when studying individuals who are interesting to researchers because they have a rare characteristic. Therefore, the individuals who serve as the focus of case studies are not like most other people. If scientists ultimately want to explain all behavior, focusing attention on such a special group of people can make it difficult to generalize any observations to the larger population as a whole. Generalizing refers to the ability to apply the findings of a particular research project to larger segments of society. Again, case studies provide enormous amounts of information, but since the cases are so specific, the potential to apply what’s learned to the average person may be very limited.[5]
How is the Case Study Conducted?
The procedure used in a case study means that the researcher provides a description of the behavior. This comes from interviews and other sources, such as observation.
The client also reports detail of events from his or her point of view. The researcher then writes up the information from both sources above as the case study and interprets the information. The research may also continue for an extended period of time, so processes and developments can be studied as they happen.
Amongst the sources of data the psychologist is likely to turn to when carrying out a case study are observations of a person’s daily routine, unstructured interviews with the participant herself (and with people who know her), diaries, personal notes (e.g. letters, photographs, notes) or official document (e.g. case notes, clinical notes, appraisal reports).
The case study method often involves simply observing what happens to, or reconstructing the case history of a single participant or group of individuals (such as a school class or a specific social group), i.e. the idiographic approach.
The interview is also an extremely effective procedure for obtaining information about an individual, and it may be used to collect comments from the person’s friends, parents, employer, workmates and others who have a good knowledge of the person, as well as to obtain facts from the person him or herself.
Most of this information is likely to be qualitative (i.e. verbal description rather than measurement) but the psychologist might collect numerical data as well.
Strengths of Case Studies
- Provides detailed (rich qualitative) information.
- Provides insight for further research.
- Permitting investigation of otherwise impractical (or unethical) situations.
Case studies allow a researcher to investigate a topic in far more detail than might be possible if they were trying to deal with a large number of research participants (nomothetic approach) with the aim of ‘averaging’.
Because of their in-depth, multi-sided approach case studies often shed light on aspects of human thinking and behavior that would be unethical or impractical to study in other ways.
Research which only looks into the measurable aspects of human behavior is not likely to give us insights into the subjective dimension to experience which is so important to psychoanalytic and humanistic psychologists.
Case studies are often used in exploratory research. They can help us generate new ideas (that might be tested by other methods). They are an important way of illustrating theories and can help show how different aspects of a person’s life are related to each other.
The method is therefore important for psychologists who adopt a holistic point of view (i.e. humanistic psychologists).
Limitations of Case Studies
- Lacking scientific rigor and providing little basis for generalization of results to the wider population.
- Researchers’ own subjective feeling may influence the case study (researcher bias).
- Difficult to replicate.
- Time-consuming and expensive.
- The volume of data, together with the time restrictions in place, impacted on the depth of analysis that was possible within the available resources.
Because a case study deals with only one person/event/group we can never be sure if the case study investigated is representative of the wider body of “similar” instances. This means the conclusions drawn from a particular case may not be transferable to other settings.
Because case studies are based on the analysis of qualitative (i.e. descriptive) data a lot depends on the interpretation the psychologist places on the information she has acquired.
This means that there is a lot of scope for observer bias and it could be that the subjective opinions of the psychologist intrude in the assessment of what the data means.
For example, Freud has been criticized for producing case studies in which the information was sometimes distorted to fit the particular theories about behavior (e.g. Little Hans).
This is also true of Money’s interpretation of the Bruce/Brenda case study (Diamond, 1997) when he ignored evidence that went against his theory.[4]
Naturalistic Observations/ Observational Research Methodology
Observational studies involve watching and recording the actions of participants. This may take place in the natural setting, such as observing children at play at a park, or behind a one-way glass while children are at play in a laboratory playroom. The researcher may follow a checklist and record the frequency and duration of events (perhaps how many conflicts occur among 2- year-olds) or may observe and record as much as possible about an event (such as observing children in a classroom and capturing the details about the room design and what the children and teachers are doing and saying).[5]
We want our researcher to be inconspicuous—perhaps, as mentioned above standing behind one-way glass. This type of observational study is called naturalistic observation: observing behavior in its natural setting. To better understand peer exclusion, Suzanne Fanger collaborated with colleagues at the University of Texas to observe the behavior of preschool children on a playground. How did the observers remain inconspicuous over the duration of the study? They equipped a few of the children with wireless microphones (which the children quickly forgot about) and observed while taking notes from a distance. Also, the children in that particular preschool (a “laboratory preschool”) were accustomed to having observers on the playground (Fanger, Frankel, & Hazen, 2012).
It is critical that the observer be as unobtrusive and as inconspicuous as possible: when people know they are being watched, they are less likely to behave naturally. If you have any doubt about this, ask yourself how your driving behavior might differ in two situations: In the first situation, you are driving down a deserted highway during the middle of the day; in the second situation, you are being followed by a police car down the same deserted highway (Figure 1).
It should be pointed out that naturalistic observation is not limited to research involving humans. Indeed, some of the best-known examples of naturalistic observation involve researchers going into the field to observe various kinds of animals in their own environments. As with human studies, the researchers maintain their distance and avoid interfering with the animal subjects so as not to influence their natural behaviors. Scientists have used this technique to study social hierarchies and interactions among animals ranging from ground squirrels to gorillas. The information provided by these studies is invaluable in understanding how those animals organize socially and communicate with one another. The anthropologist Jane Goodall,(image below) for example, spent nearly five decades observing the behavior of chimpanzees in Africa. As an illustration of the types of concerns that a researcher might encounter in naturalistic observation, some scientists criticized Goodall for giving the chimps names instead of referring to them by numbers—using names was thought to undermine the emotional detachment required for the objectivity of the study (McKie, 2010).

The greatest benefit of naturalistic observation is the validity, or accuracy, of information collected unobtrusively in a natural setting. Having individuals behave as they normally would in a given situation means that we have a higher degree of ecological validity, or realism, than we might achieve with other research approaches. Therefore, our ability to generalize the findings of the research to real-world situations is enhanced. If done correctly, we need not worry about people or animals modifying their behavior simply because they are being observed. Sometimes, people may assume that reality programs give us a glimpse into authentic human behavior. However, the principle of inconspicuous observation is violated as reality stars are followed by camera crews and are interviewed on camera for personal confessionals. Given that environment, we must doubt how natural and realistic their behaviors are.
The major downside of naturalistic observation is that they are often difficult to set up and control. In our restroom study, what if you stood in the restroom all day prepared to record people’s hand washing behavior and no one came in? Or, what if you have been closely observing a troop of gorillas for weeks only to find that they migrated to a new place while you were sleeping in your tent? The benefit of realistic data comes at a cost. As a researcher you have no control of when (or if) you have behavior to observe. In addition, this type of observational research often requires significant investments of time, money, and a good dose of luck.
Sometimes studies involve structured observation. In these cases, people are observed while engaging in set, specific tasks. An excellent example of structured observation comes from the Strange Situation by Mary Ainsworth (you will read more about this later). The Strange Situation is a procedure used to evaluate attachment styles that exist between an infant and caregiver. In this scenario, caregivers bring their infants into a room filled with toys. The Strange Situation involves a number of phases, including a stranger coming into the room, the caregiver leaving the room, and the caregiver’s return to the room. The infant’s behavior is closely monitored at each phase, but it is the behavior of the infant upon being reunited with the caregiver that is most telling in terms of characterizing the infant’s attachment style with the caregiver.
Another potential problem in observational research is observer bias. Generally, people who act as observers are closely involved in the research project and may unconsciously skew their observations to fit their research goals or expectations. To protect against this type of bias, researchers should have clear criteria established for the types of behaviors recorded and how those behaviors should be classified. In addition, researchers often compare observations of the same event by multiple observers, in order to test inter-rater reliability: a measure of reliability that assesses the consistency of observations by different observers.[6]
Survey Methodology
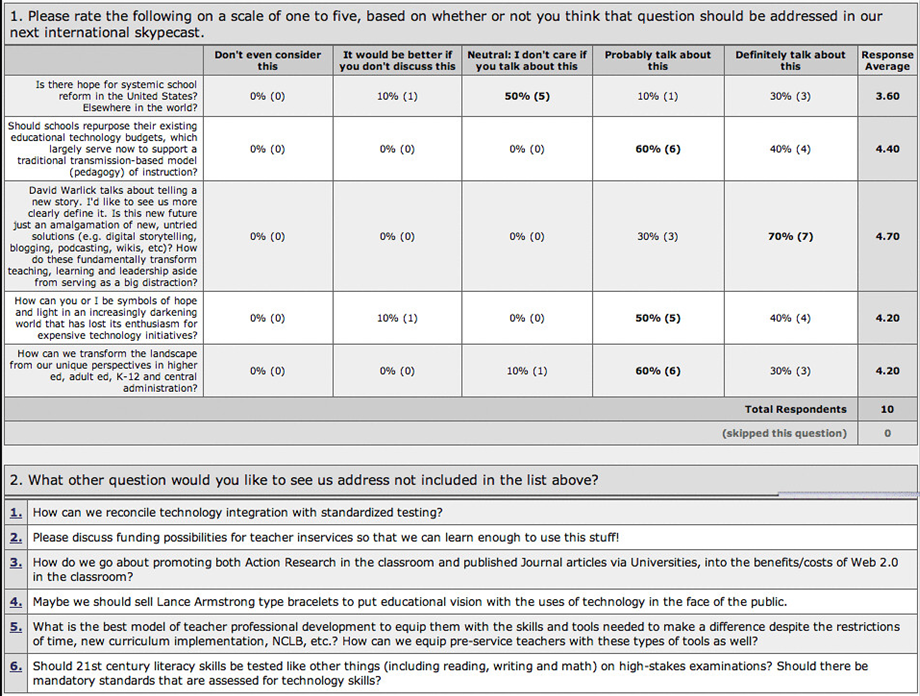
Surveys are familiar to most people because they are so widely used. Surveys enhance accessibility to subjects because they can be conducted in person, over the phone, through the mail, or online. A survey involves asking a standard set of questions to a group of subjects. In a highly structured survey, subjects are forced to choose from a response set such as “strongly disagree, disagree, undecided, agree, strongly agree”; or “0, 1-5, 6-10, etc.” Surveys are commonly used by sociologists, marketing researchers, political scientists, therapists, and others to gather information on several variables in a relatively short period of time. Surveys typically yield surface information on a wide variety of factors but may not allow for in-depth understanding of human behavior. Of course, surveys can be designed in a number of ways. They may include forced choice questions and semi-structured questions in which the researcher allows the respondent to describe or give details about certain events. One of the most difficult aspects of designing a good survey is wording questions in an unbiased way and asking the right questions so that respondents can give a clear response rather that choosing “undecided” each time. Knowing that 30% of respondents are undecided is of little use! So, a lot of time and effort should be placed on the construction of survey items. One of the benefits of having forced choice items is that each response is coded so that the results can be quickly entered and analyzed using statistical software. Analysis takes much longer when respondents give lengthy responses that must be analyzed in a different way. Surveys are useful in examining stated values, attitudes, opinions, and reporting on practices. However, they are based on self-report or what people say they do rather than on observation and this can limit accuracy.[7]
The Survey Below Asks Questions Regarding School Reform[8]
Interviews
Rather than surveying participants, they can be interviewed which means they are directly questioned by a researcher. Interviewing participants on their behaviors or beliefs can solve the problem of misinterpreting the questions posed on surveys. The examiner can explain the questions and further probe responses for greater clarity and understanding. Although this can yield more accurate results, interviews take longer and are more expensive to administer than surveys. Participants can also demonstrate social desirability, which will affect the accuracy of the responses.
Psychophysiological Assessment
Researchers may also record psychophysiological data, such as measures of heart rate, hormone levels, or brain activity to help explain development. These measures may be recorded by themselves or in combination with behavioral data to better understand the bidirectional relations between biology and behavior. Special equipment has been developed to allow researchers to record the brain activity of infants and children. One manner of understanding associations between brain development and behavioral advances is through the recording of event-related potentials (ERPs). ERPs are recorded by fitting a research participant with a stretchy cap that contains many small sensors or electrodes. These electrodes record tiny electrical currents on the scalp of the participant in response to the presentation of stimuli, such as a picture or a sound.
The use of ERPs has provided important insight as to how infants and children understand the world around them. Webb, Dawson, Bernier, and Panagiotides (2006) examined face and object processing in children with autism spectrum disorders, those with developmental delays, and those who were typically developing. The children wore electrode caps and had their brain activity recorded as they watched still photographs of faces of their mother or of a stranger, and objects, including those that were familiar or unfamiliar to them. The researchers examined differences in face and object processing by group by observing a component of the brainwaves. Findings suggest that children with autism are in some way processing faces differently than typically developing children and those with more general developmental delays.

An infant wearing a skull-cap that contains electrodes during an event-related potential (ERP) recording
Secondary/Content Analysis or Archival Research
Secondary/content analysis or archival research involves analyzing information that has already been collected or examining documents or media to uncover attitudes, practices or preferences. There are many data sets available to those who wish to conduct this type of research. For example, the U. S. Census Data is available and widely used to look at trends and changes taking place in the United States. The researcher conducting secondary analysis does not have to recruit subjects but does need to know the quality of the information collected in the original study.
Correlational Research
In contrast to descriptive research, which is designed primarily to provide static pictures, correlational research involves the measurement of two or more variables (a variable is anything that can change in value) and an assessment of the relationship between or among those variables. For instance, the variables of height and weight are systematically related (correlated) because taller people generally weigh more than shorter people.
The Pearson Correlation Coefficient, symbolized by the letter r, is the most common statistical measure of the strength of linear relationships among variables. The value of the correlation coefficient ranges from r= –1.00 to r = 1.00. The strength of the linear relationship is indexed by the distance of the correlation coefficient from zero (its absolute value). For instance, r = –.54 is a stronger relationship than r= .30, and r = .72 is a stronger relationship than r = –.57. The direction of the linear relationship is indicated by the sign of the correlation coefficient. Positive values of r (such as r = .54 or r = .67) indicate that the relationship is positive (i.e., the pattern of the dots on the scatter plot runs from the lower left to the upper right), whereas negative values of r (such as r = –.30 or r = –.72) indicate negative relationships (i.e., the dots run from the upper left to the lower right).
Examples of positive and negative correlational data presented as scatterplots
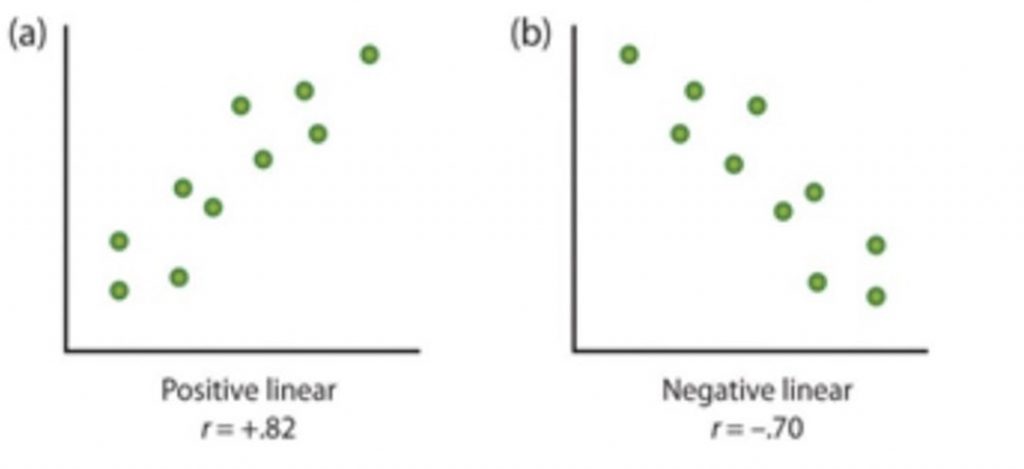
When the straight line indicates that individuals who have high values for one variable also tend to have high values for the other variable, as in part (a) above, the relationship is said to be a positive correlation. Examples of positive correlations include those between education and income, and between age and mathematical abilities in children. In each case people who score higher on one of the variables also tend to score higher on the other variable. Negative correlations, in contrast, as shown in part (b) above, occur when high values for one variable tend to be associated with low values for the other variable. Examples of negative correlations include those between the age of a child and the number of diapers the child uses, and between practice and errors made on a learning task. In these cases, people who score higher on one of the variables tend to score lower on the other variable.[9]
An example of how a scatterplot might look in the case where a study finds that kindergarten and elementary school children who were better at rhymes and hearing the sounds of individual letters before they started to read later learn to read words more quickly than children who were not as good with making an distinguishing elementary sounds of language can be found below.
Scatterplot Between Speed of Learning to Read and Ability to Make and Hear Language-Related Sounds
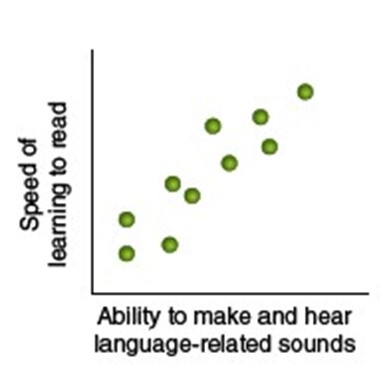
The above scatter plots shows that the relationship between “Speed of Learning to Read” and the “Ability to Make and Hear Language-Related Sounds is “positive” and “strong.“[10]
An important limitation of correlational research designs is that they cannot be used to draw conclusions about the causal relationships among the measured variables. In other words, CORRELATION IS NOT CAUSATION. Consider, for instance, a researcher who has hypothesized that viewing violent behavior will cause increased aggressive play in children. He has collected, from a sample of fourth-grade children, a measure of how much violent television each child views during the week, as well as a measure of how aggressively each child plays. The researcher discovers a positive correlation between the two measured variables. Although this positive correlation appears to support the hypothesis, it cannot be taken to indicate that viewing violent television causes aggressive behavior or aggressive behavior causes one to view violent television. Another possible explanation for the observed correlation is that it has been produced by the presence of a third variable.
A third or extraneous variable is a variable that is not part of the research hypothesis but produces the observed correlation between them. In our example a potential third variable is the discipline style of the children’s parents. Parents who use a harsh and punitive discipline style may produce children who both like to watch violent television and who behave aggressively in comparison to children whose parents use less harsh discipline.
For this reason, we are left with the basic limitation of correlational research: Correlation does not demonstrate causation! It is important that when you read about correlational research projects, you keep in mind the possibility of third variables.
Strengths and limitations of Correlational Research
Correlational research can be used when experimental research is not possible because the variables either cannot be manipulated, or it would be unethical to use an experiment. Correlational designs also have the advantage of allowing the researcher to study behavior as it occurs in everyday life. We can also use correlational designs to make predictions. For instance, we can predict from the scores on a battery of tests the success of job trainees during a training session. However, we cannot use such correlational information to determine whether one variable caused another variable. For that, researchers rely on an experiment.
Experimental Research
In order to conduct an experiment, a researcher must have a specific hypothesis to be tested. As you’ve learned, hypotheses can be formulated either through direct observation of the real world or after careful review of previous research. For example, if you think that children should not be allowed to watch violent programming on television because doing so would cause them to behave more violently, then you have basically formulated a hypothesis—namely, that watching violent television programs causes children to behave more violently. How might you have arrived at this particular hypothesis? You may have younger relatives who watch cartoons featuring characters using martial arts to save the world from evildoers, with an impressive array of punching, kicking, and defensive postures. You notice that after watching these programs for a while, your young relatives mimic the fighting behavior of the characters portrayed in the cartoon.
These sorts of personal observations are what often lead us to formulate a specific hypothesis, but we cannot use limited personal observations and anecdotal evidence to rigorously test our hypothesis. Instead, to find out if real-world data supports our hypothesis, we have to conduct an experiment.[11]
Three conditions must be met to establish cause and effect. Experimental designs are useful in meeting these conditions.
- The independent variable and the dependent variable must be related. In other words, when one is altered, the other changes in response. (The independent variable is something altered or introduced by the researcher. The dependent variable is the outcome that is measured, or the factor affected by the introduction of the independent variable. For example, if we are looking at the impact of different levels of intervention on reading scores, the independent variable would be the level of intervention and the dependent variable would be the reading scores.)
- The cause must come before the effect. Experiments involve measuring subjects on the dependent variable before exposing them to the independent variable (establishing a baseline). So, we would measure the subjects’ level of reading before introducing the intervention program and then again after the intervention program to see if there has been a change in reading scores. (Observational and survey research does not always allow us to look at the timing of these events, which makes understanding causality problematic with these designs.)
- The cause must be isolated. The researcher must ensure that no outside, perhaps unknown or confounding variables are causing the effect we see. The experimental design helps make this possible. In an experiment, we would make sure that our subjects did not receive any intervention at home or at an after-school program. Otherwise these additional interventions might influence reading scores. [12]
Designing an Experiment
The most basic experimental design involves two groups: the experimental group and the control group. The two groups are designed to be the same except for one difference— experimental manipulation. The experimental group gets the experimental manipulation—that is, the treatment or variable being tested (in this case, violent TV images)—and the control group does not. Since experimental manipulation is the only difference between the experimental and control groups, we can be sure that any differences between the two are due to experimental manipulation rather than chance.
In our example of how violent television programming might affect violent behavior in children, we have the experimental group view violent television programming for a specified time and then measure their violent behavior. We measure the violent behavior in our control group after they watch nonviolent television programming for the same amount of time. It is important for the control group to be treated similarly to the experimental group, with the exception that the control group does not receive the experimental manipulation. Therefore, we have the control group watch non-violent television programming for the same amount of time as the experimental group.
We also need to precisely define, or operationalize, what is considered violent and nonviolent. An operational definition is a description of how we will measure our variables, and it is important in allowing others understand exactly how and what a researcher measures in a particular experiment. In operationalizing violent behavior, we might choose to count only physical acts like kicking or punching as instances of this behavior, or we also may choose to include angry verbal exchanges. Whatever we determine, it is important that we operationalize violent behavior in such a way that anyone who hears about our study for the first time knows exactly what we mean by violence. This aids peoples’ ability to interpret our data as well as their capacity to repeat our experiment should they choose to do so.
Test Your Knowledge of a Good Operational Definition: Below you will find 5 suggested operational definitions. For each statement, determine whether or not the statement either provides a good example of an operational definition (True), or does not provide a good example of an operational definition (False).
Once we have operationalized what is considered violent television programming and what is considered violent behavior from our experiment participants, we need to establish how we will run our experiment. In this case, we might have participants watch a 30-minute television program (either violent or nonviolent, depending on their group membership) before sending them out to a playground for an hour where their behavior is observed and the number and type of violent acts is recorded.
Ideally, the people who observe and record the children’s behavior are unaware of who was assigned to the experimental or control group, in order to control for experimenter bias. Experimenter bias refers to the possibility that a researcher’s expectations might skew the results of the study. Remember, conducting an experiment requires a lot of planning, and the people involved in the research project have a vested interest in supporting their hypotheses. If the observers knew which child was in which group, it might influence how much attention they paid to each child’s behavior as well as how they interpreted that behavior. By being blind to which child is in which group, we protect against those biases. This situation is a single-blind study, meaning that one of the groups (participants) are unaware as to which group they are in (experiment or control group) while the researcher who developed the experiment knows which participants are in each group.
In a double-blind study, both the researchers and the participants are blind to group assignments. Why would a researcher want to run a study where no one knows who is in which group? Because by doing so, we can control for both experimenter and participant expectations. If you are familiar with the phrase placebo effect, you already have some idea as to why this is an important consideration. The placebo effect occurs when people’s expectations or beliefs influence or determine their experience in a given situation. In other words, simply expecting something to happen can actually make it happen.
The placebo effect is commonly described in terms of testing the effectiveness of a new medication. Imagine that you work in a pharmaceutical company, and you think you have a new drug that is effective in treating depression. To demonstrate that your medication is effective, you run an experiment with two groups: The experimental group receives the medication, and the control group does not. But you don’t want participants to know whether they received the drug or not.
Why is that? Imagine that you are a participant in this study, and you have just taken a pill that you think will improve your mood. Because you expect the pill to have an effect, you might feel better simply because you took the pill and not because of any drug actually contained in the pill—this is the placebo effect.
To make sure that any effects on mood are due to the drug and not due to expectations, the control group receives a placebo (in this case a sugar pill). Now everyone gets a pill, and once again neither the researcher nor the experimental participants know who got the drug and who got the sugar pill. Any differences in mood between the experimental and control groups can now be attributed to the drug itself rather than to experimenter bias or participant expectations.[13]
Independent and Dependent Variables
In a research experiment, we strive to study whether changes in one thing cause changes in another. To achieve this, we must pay attention to two important variables, or things that can be changed, in any experimental study: the independent variable and the dependent variable. An independent variable is manipulated or controlled by the experimenter. In a well-designed experimental study, the independent variable is the only important difference between the experimental and control groups. In our example of how violent television programs affect children’s display of violent behavior, the independent variable is the type of program—violent or nonviolent—viewed by participants in the study (Figure 3). A dependent variable is what the researcher measures to see how much effect the independent variable had. In our example, the dependent variable is the number of violent acts displayed by the experimental participants.
The Influence of the Independent Variable on the Dependent Variable
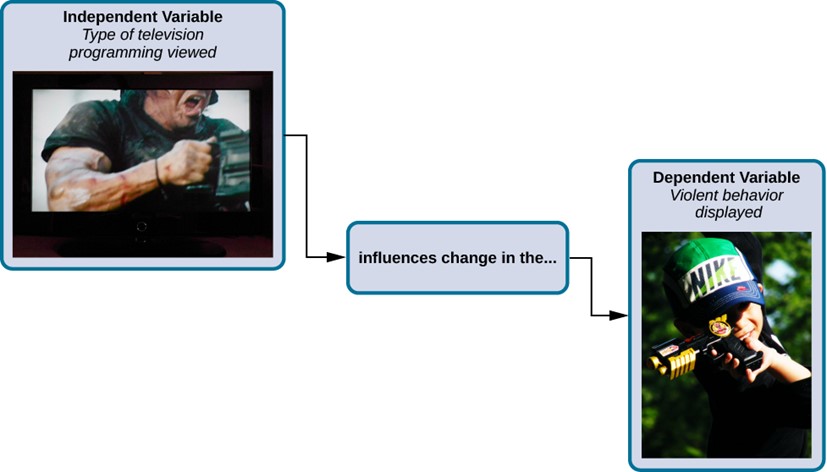
In an experiment, manipulations of the independent variable are expected to result in changes in the dependent variable. (credit “automatic weapon”: modifications of work by Daniel Oines: credit “toy gun”: modifications of work by Emran Kassim)
We expect that the dependent variable will change as a function of the independent variable. In other words, the dependent variable depends on the independent variable. A good way to think about the relationship between the independent and dependent variables is with this question: What effect does the independent variable have on the dependent variable? Returning to our example, what effect does watching a half hour of violent television programming or nonviolent television programming have on the number of incidents of physical aggression displayed on the playground?
Selecting and Assigning Experimental Participants
Now that our study is designed, we need to obtain a sample of individuals to include in our experiment. Our study involves human participants so we need to determine who to include. Participants are the subjects of psychological research, and as the name implies, individuals who are involved in psychological research actively participate in the process. Often, psychological research projects rely on college students to serve as participants. In fact, the vast majority of research in psychology subfields has historically involved students as research participants (Sears, 1986; Arnett, 2008). But are college students truly representative of the general population? College students tend to be younger, more educated, more liberal, and less diverse than the general population. Although using students as test subjects is an accepted practice, relying on such a limited pool of research participants can be problematic because it is difficult to generalize findings to the larger population.
Our hypothetical experiment involves children, and we must first generate a sample of child participants. Samples are used because populations are usually too large to reasonably involve every member in our particular experiment. If possible, we should use a random sample (there are other types of samples, but for the purposes of this section, we will focus on random samples). A random sample is a subset of a larger population in which every member of the population has an equal chance of being selected. Random samples are preferred because if the sample is large enough, we can be reasonably sure that the participating individuals are representative of the larger population. This means that the percentages of characteristics in the sample—sex, ethnicity, socioeconomic level, and any other characteristics that might affect the results—are close to those percentages in the larger population.
In our example, let’s say we decide our population of interest is fourth graders. But all fourth graders is a very large population, so we need to be more specific; instead we might say our population of interest is all fourth graders in a particular city. We should include students from various income brackets, family situations, races, ethnicities, religions, and geographic areas of town. With this more manageable population, we can work with the local schools torandomly select around 200 fourth graders who we want to participate in our experiment.
In summary, because we cannot test all of the fourth graders in a city, we want to find a group of about 200 that reflects the composition of that city. With a representative group, we can generalize our findings to the larger population without fear of our sample being biased in some way.
Now that we have a sample, the next step of the experimental process is to split the participants into experimental and control groups through random assignment. With random assignment, all participants have an equal chance of being assigned to either group. There is statistical software that will randomly assign each of the fourth graders in the sample to either the experimental or the control group.
Random assignment is critical for sound experimental design. With sufficiently large samples, random assignment makes it unlikely that there are systematic differences between the groups. So, for instance, it would be very unlikely that we would get one group composed entirely of males, a given ethnic identity, or a given religious ideology. This is important because if the groups were systematically different before the experiment began, we would not know the origin of any differences we find between the groups: Were the differences preexisting, or were they caused by manipulation of the independent variable? Random assignment allows us to assume that any differences observed between experimental and control groups result from the manipulation of the independent variable.[14]
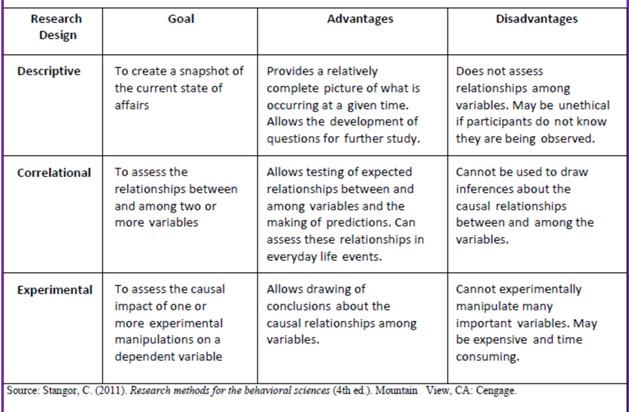
Despite the advantage of determining causation, experiments do have limitations. One is that they are often conducted in laboratory situations rather than in the everyday lives of people. Therefore, we do not know whether results that we find in a laboratory setting will necessarily hold up in everyday life. Second, and more important, is that some of the most interesting and key social variables cannot be experimentally manipulated because of ethical concerns. If we want to study the influence of abuse on children’s development of depression, these relationships must be assessed using correlational designs because it is simply not ethical to experimentally manipulate these variables. Characteristics of descriptive, correlational, and experimental research designs can be found in the following table.[15],[16]
Table describing the type of research design with corresponding Goal, Advantages, and Disadvantages.
Developmental Research Designs
While research methods are tools that are used to collect information, research design is the strategy or blueprint for deciding how to collect and analyze information. Research design dictates which research methods are used and how. When we are trying to describe development and change, the research designs become especially important because we are interested in what changes and what stays the same with age.[19] Developmental researchers typically use one of three types of developmental research design, either cross-sectional, longitudinal, or cross-sequential/sequential.
Cross-Sectional, Longitudinal and Cross Sequential/Sequential Research Designs
Cross Sectional Research Designs
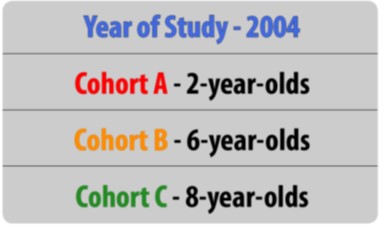
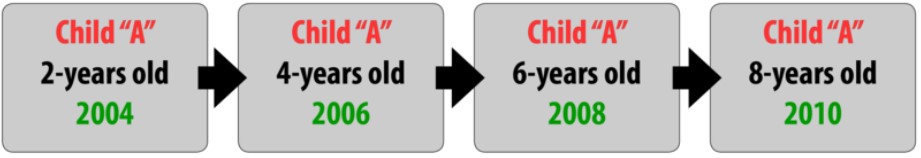
Cross-sectional research compares samples that represent a cross-section of the population who vary in age. Participants might be asked to complete a survey or take a test of some physical or cognitive skill. The attitudes or skill levels based on age are compared. In cross-sectional research, respondents are measured only once, and consequently this method is not expensive or time consuming. In addition, because participants are only tested at one point in time, practice effects are not an issue as children do not have the opportunity to become better at the task over time. There is also no need to keep in contact with, or follow-up with, participants over time. The table[17] below shows that the study included a group of 2-year-olds, a group of 6-year-olds and a group of 8-year-olds.
Cohort Group Participants of a Cross-Sectional Design
However, cross-sectional research does not allow the researcher to look at the impact of having been born in a certain time-period, which is known as the cohort effect. For example, those born during the depression have very different views about and experiences with the internet than those born in the last twenty years. Different attitudes about the Internet, for example, might not be due to a person’s biological age as much as their life experiences as members of a cohort.[18]
Longitudinal Research Designs
Longitudinal research involves studying a group of people who are the same age and measuring them repeatedly over a period-of-time. This type of design allows researchers to study individual differences in development. Longitudinal studies may be conducted over the short term, such as a span of months, or over much longer durations including years or decades. For these reasons, longitudinal research designs are optimal for studying stability and change over time.
Cohort Group Participants of a Longitudinal Design
Problems with longitudinal research include being very time consuming and expensive. Researchers must maintain continued contact with participants over time, and these studies necessitate that scientists have funding to conduct their work over extended durations. An additional risk is attrition. Attrition occurs when participants fail to complete all portions of a study. Participants may move, change their phone numbers, or simply become disinterested in participating over time. Researchers should account for the possibility of attrition by enrolling a larger sample into their study initially, as some participants will likely drop out over time. Even with a large sample size, the experimenter never knows if there was something different about the individuals who dropped out versus those that remained in the study.
The results from longitudinal studies may also be impacted by repeated assessments. Consider how well you would do on a math test if you were given the exact same exam every day for a week. Your performance would likely improve over time not necessarily because you developed better math abilities, but because you were continuously practicing the same math problems. This phenomenon is known as a practice effect. Practice effects occur when participants become better at a task over time because they have done it again and again; not due to natural psychological development.[19]
Cross-Sequential/Sequential Designs
Cross-sequential research includes elements of both longitudinal and cross-sectional research designs. Like longitudinal designs, sequential research features participants who are followed over time; like cross-sectional designs, sequential work includes participants of different ages. This research design is also distinct from those that have been discussed previously in that individuals of different ages are enrolled into a study at various points in time to examine age-related changes, development within the same individuals as they age, and account for the possibility of cohort effects.[20]
Cohort Group Participants of a Cross-Sequential Design
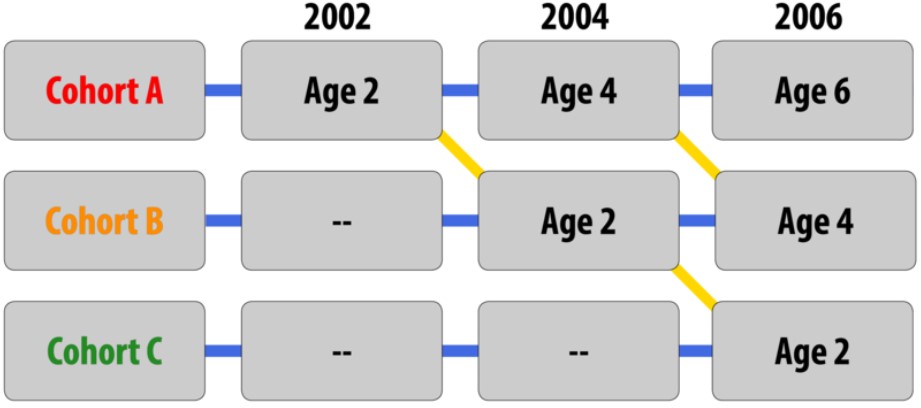
For example, in a study with a sequential design, a researcher might enroll three separate groups of children (Groups A, B, and C). Children in Group A would be enrolled when they are 2 years old and would be tested again when they are 4 and 6 years old. This is similar in design to the longitudinal study described previously. Children in Group B would also be enrolled when they are 2 years old, but this would occur two years later when Group A is now 4 years old. Finally, children in Group C would be enrolled when they are 2 years old and Group A is now 6 and Group B is now 4. At this time, the children would represent a cross-sectional design (2, 4, and 6 years of age). Further, along the diagonal children of the same age can be compared to determine if cohort effects are evident. Sequential designs are appealing because they allow researchers to learn a lot about development in a relatively short amount of time.
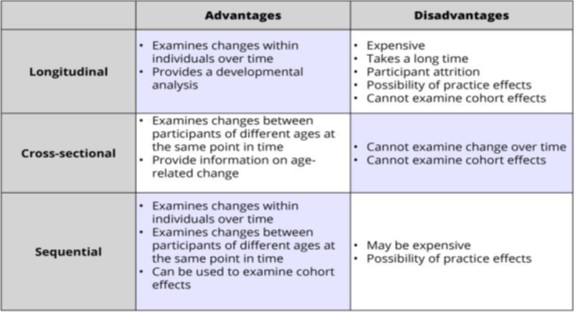
Because they include elements of longitudinal and cross-sectional designs, sequential research has many of the same strengths and limitations as these other approaches. For example, sequential work may require less time and effort than longitudinal research, but more time and effort than cross-sectional research. Although practice effects may be an issue if participants are asked to complete the same tasks or assessments over time, attrition may be less problematic than what is commonly experienced in longitudinal research since participants may not have to remain involved in the study for such a long period-of-time.[21] The table that follows summarizes the advantages and disadvantages of developmental research designs.
Advantages and Disadvantages of Developmental Research Designs [27]
Preferential Looking and Habituation
Conducting psychological experiments that involve infant participants can be difficult. Infants may fall asleep or cry during procedures, and typically do not follow instructions well. The most difficult aspect of working with infants is their lack of language abilities. In other words, infants can’t tell you what they think, believe, or feel like adults can. However, infant visual capabilities while not as developed as older children or adults can be used to provide researchers with insights into their cognitive abilities.
Preferential Looking
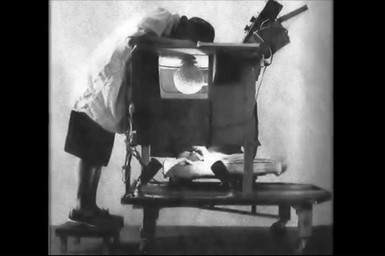
In 1961 Robert L. Fantz introduced the visual preference paradigm. The technique was simple, show infants two different stimuli paired alongside each other and measure how long the infant would look at either stimulus. Fantz concluded that the stimulus the infants looked longer at was the preferred stimulus. As he continued his technique, he began to find similar preference patterns among infants. For example, Fantz showed that from 2 months of age, infants preferred complex images like bulls-eyes over plain white or black circles. One of his more interesting findings is that newborns and infants prefer faces and face-like patterns over non-face-like patterns. This finding led Fantz to hypothesize that this preference was an innate ability that might serve to enhance survival of the newborn and infant.
Fantz’s Looking Chamber
The preferential looking technique can be used to test infant visual acuity. In this case infants are shown several presentations of different stimuli consisting of black and white stripes of varying widths alongside a control stimulus (a uniform grey disc). When the looking time between the two stimuli is approximately 50% for either stimulus the infant’s visual acuity limit has been reached.
Finally, the concept behind the preferential looking technique have been adapted for use in the study of audition. The head-turn preference procedure (HPP) or preferential listening paradigm is used to explore infants’ ability to discriminate between auditory stimuli.
Infant Preferential Looking
 Testing an infant’s visual acuity using a preferential looking technique and Teller Acuity Cards. The width of the stripes corresponds to Snellen Acuity values. [22]
Habituation
Fantz was one of the first researchers to make use of the habituation technique (although he did not refer to the technique as “habituation) to study human infant perceptual and cognitive abilities.
In habituation studies, infants are presented with a stimulus such as a photograph of a face over several trials until they become bored with it. Typically, when infants become bored, they will look away from the picture. Once the infant has been habituated, or bored, a new or test stimulus is then paired with the original stimulus. Therefore, if the infant is shown a new picture–such as a photograph of a different face paired with the original picture, their interest will return, and they will look longer at the new picture. This is a phenomenon known as dishabituation. Habituation procedures work because infants generally look longer at novel stimuli relative to items that are familiar to them. This research technique takes advantage of involuntary or obligatory responses because infants are constantly looking around and observing their environments; they do not have to be taught to engage with the world in this way.[23]
Types of Habituation Protocols
Fixed Trial Habituation Protocols and the Infant-Controlled Procedure
The simplest habituation protocols are fixed trial (FT) procedures, which involve administering a set of discrete, repetitive stimulus presentations to an infant; each trial has a fixed duration, and a fixed inter-trial interval. For example, one might present 8 trials of a checkerboard to an infant, each lasting 10 s with a 10 s inter-trial interval (e.g., Colombo et al., 1997). In simple FT protocols, the presentations are in no way linked to, or contingent upon, the infant’s behavior or visual attention; the infant is free to look or not look at the stimulus, and the procedure continues. There are a number of distinct advantages to running FT procedures: they are easy to automate, easy to conduct, and they yield data that are simple, uniform for each subject, and easy to analyze. The drawback of FT protocols, however, is that individual infants may habituate at different rates. To the degree that habituation rate reflects stimulus encoding (a central tenet of the comparator model), this implies that at the end of the FT protocol, infants may be at very different levels of processing. For instance, in the example described above (8 trials at 10 seconds each), infants might have looked for as much as 80 seconds and as little as 0 seconds. If one is interested in individual differences in infant processing, this may well be desirable (presuming that the infant has, in fact, looked at the stimulus), as it becomes analogous to a speeded cognitive task, where subjects are given a limited amount of time or exposure to an item before being administered a probe. However, if the aim of the protocol is to demonstrate a generic infant ability or skill, individual and developmental differences in visual behavior may obscure group effects that one is seeking to establish.[24]
This problem is addressed by the development of the infant-controlled procedure (ICP; Horowitz et al., 1972). There are two major differences between this procedure and the fixed trial protocol. The first is that the infant is administered repetitive stimulus presentations, but the beginning and end of the trial is contingent upon the infant’s looking. That is, the trial is not considered to start until the infant has looked at the stimulus, and it is terminated when the infant looks away.
Second, the trials continue until the infant has reduced their looking to some criterion. This criterion may be absolute (e.g., the sessions may end when the infant looks for a total of, say, no more than 3 seconds), but more often the criterion is relative to the infant’s initial level of looking. For example, the infant may be required to show a decline to a particular percentage (typically 50%) of their initial or longest levels. For example, an experimenter determines the average of the first three trials of looking and continues until the last three trials of looking average 50% or below the average of the first three trials. In this case, the trials can last anywhere from six trials and longer and will continue until the criteria specified has been reached. It should be noted that the use of a relative criterion makes theoretical sense from the point of view of the comparator model; if the initial size of the OR (i.e., the length of the look) represents the response when there is no internal representation of the stimulus, then using a constant percentage of decline as a criterion for habituation theoretically equates all of the subjects for the extent to which the external stimulus is encoded. We note that this reasoning is based on a set of assumptions with regard to looking and the OR, but it is also reasonable to point out that the ICP works extremely well in practice.
There are several other issues to consider with respect to the ICP, however. The first one is that this procedure is more difficult to design and implement than the FT protocol. Because criteria are computed, set, and typically reset several times within a session (based on the looks that the infant makes to the stimulus), it is difficult to conduct this without the aid of a microcomputer and custom programming.
Second, there are many decisions to be made about the parameters of the habituation protocol, for which there are neither consensual standards nor empirical evidence to guide the investigator. For example, instead of using the average of the first three trials of looking as a comparison, a researcher may decide to use the average of the first two looking trials as the baseline for comparison. These decisions can complicate the programming for the administration of the task. Group habituation curves will mislead many novice investigators into thinking that the first look of a habituation sequence is always the longest one. In fact, however, this occurs only about 60% of the time (Colombo & Mitchell, 1990). Thus, it is common to encounter long looks quite late in the habituation session, and if the habituation criterion is rigidly set by the length of the initial looks, infants will continue on in the session longer than necessary or may fail to attain the habituation criterion at all. In response to this, many investigators choose to allow the habituation criterion to “float,” or to be reset when longer looks occur later (i.e., beyond the first or second look) in the habituation sequence. In addition, the number of looks on which the criterion is based can vary; it may be based on the longest look, or the average of the two longest looks, or so forth. Similar issues must be faced when choosing how many criterion looks must be elicited to consider the infant to have habituated; here, the standard used by most investigators is two consecutive looks at or below criterion, but there is no empirical justification for this. accepted standard.
Third, the ICP dictates that the coding of looks must be done online, because the criterion for habituation is based on the duration of looks that have been observed earlier in the session. This has some implications for the reliability of online coding, but the coding of looks using the corneal reflection technique (or other less restrictive judgment criteria) tends to be quite easy and reliable. However, because the individual “look” now serves as the primary datum within the session, one must decide what constitutes a “look.” It is possible to place no constraints on the definition of a look; that is, to count any look to the stimulus as valid for purposes of setting or reaching the habituation criterion. However, one finds quickly that this may yield sequences of brief looks that result in very brief stimulus presentations that interfere with encoding; in addition, such looks may make it difficult to attain the habituation criterion, and have lower reliability (Colombo & Horowitz, 1985). In response, most investigators constrain the definition of looks in the ICP; looks must be of some minimum length (usually 1 or 2 sec) to be counted as valid, and be terminated by some minimum (again, 1 or 2 sec) look away from the stimulus. One of the few empirical evaluations of these procedural parameters, Colombo and Horowitz (1985) found 1 sec to be optimal for both the minimum look length and for the interval to characterize look termination, although this evidence has engendered little/no adoption of these standards, and no research has been conducted to determine whether different parameters might be appropriate for different aged infants.
Finally, it should be noted that like all criterion-based learning paradigms, the ICP will yield data sets that are not uniform in length for all participants; one infant may attain the habituation criterion in 5 looks, while another may take 25 looks to attain the criterion. As a result, the data structures for such files are not readily amenable to conventional forms of analysis and require considerable forethought in arranging.[25]
Conducting Ethical Research
As a student of psychological science, you may already know that Institutional Review Boards (IRBs) review and approve all research projects that are conducted at universities, hospitals, and other institutions. An IRB is typically a panel of experts who read and evaluate proposals for research. IRB members want to ensure that the proposed research will be carried out ethically and that the potential benefits of the research outweigh the risks and harm for participants. What you may not know though, is that the IRB considers some groups of participants to be more vulnerable or at-risk than others. Whereas university students are generally not viewed as vulnerable or at-risk, infants and young children commonly fall into this category. What makes infants and young children more vulnerable during research than young adults? One reason infants and young children are perceived as being at increased risk is due to their limited cognitive capabilities, which makes them unable to state their willingness to participate in research or tell researchers when they would like to drop out of a study. For these reasons, infants and young children require special accommodations as they participate in the research process.
When thinking about special accommodations in developmental research, consider the informed consent process. If you have ever participated in psychological research, you may know through your own experience that adults commonly sign an informed consent statement (a contract stating that they agree to participate in research) after learning about a study. As part of this process, participants are informed of the procedures to be used in the research, along with any expected risks or benefits. Infants and young children cannot verbally indicate their willingness to participate, much less understand the balance of potential risks and benefits. As such, researchers are oftentimes required to obtain written informed consent from the parent or legal guardian of the child participant, an adult who is almost always present as the study is conducted. In fact, children are not asked to indicate whether they would like to be involved in a study at all (a process known as assent) until they are approximately seven years old. Because infants and young children also cannot easily indicate if they would like to discontinue their participation in a study, researchers must be sensitive to changes in the state of the participant (determining whether a child is too tired or upset to continue) as well as to parent desires (in some cases, parents might want to discontinue their involvement in the research). As in adult studies, researchers must always strive to protect the rights and well-being of the minor participants and their parents when conducting developmental science.[26]
Decisions about whether research is ethical are made using established ethical codes developed by scientific organizations, such as the American Psychological Association, and federal governments. In the United States, the Department of Health and Human Services provides the guidelines for ethical standards in research. The following are the American Psychological Association code of ethics when using humans in research (APA, 2016).
- No Harm: The most direct ethical concern of the scientist is to prevent harm to the research participants.
- Informed Consent: Researchers must obtain informed consent, which explains as much as possible about the true nature of the study, particularly everything that might be expected to influence willingness to participate. Participants can withdraw their consent to participate at any point.
- Confidentiality: Researchers must also protect the privacy of the research participants’ responses by not using names or other information that could identify the participants.
- Deception: Deception occurs whenever research participants are not completely and fully informed about the nature of the research project before participating in it. Deception may occur when the researcher tells the participants that a study is about one thing when in fact it is about something else, or when participants are not told about the hypothesis.
- Debriefing: At the end of a study debriefing, which is a procedure designed to fully explain the purposes and procedures of the research and remove any harmful aftereffects of participation, must occur.
Test Yourself: Review of Research Methodologies
- Bower, T. G. R. (1966). The visual world of infants. Scientific American, 215(6), 80-92 ↵
- All images and text found under this footnote are from Lumenlearning, Introduction to Psychology Module 2: Psychological research is licensed under CC BY SA 4.0 (modified by Maria Pagano).[3] Introduction to Lifespan Psychology by Laura Overstreet is found on YouTube and is licensed under standard YouTube terms. (modified by Maria Pagano) ↵
- Lifespan Development: A Psychological Perspective 2nd Edition by Martha Lally and Suzanne Valentine-French is licensed under CC BY-NC-SA 3.0[5] From Lumenlearning, Introduction to Psychology Module 2: Psychological research is licensed under CC BY SA 4.0 ↵
- McLeod, S. A. (2019, August 03). Case study method. Simply Psychology is licensed under CC BY NC 3.0. ↵
- Children’s Development by Ana R. Leon is licensed under CC BY 4.0 ↵
- From Lumenlearning, Introduction to Psychology Module 2: Psychological research is licensed under CC BY SA 4.0 ↵
- Lifespan Development by Lumen Learning is licensed under CC BY 4.0 ↵
- "Skypecast Survey" by Wesley Fryer is licensed under CC BY-SA 2.0 ↵
- Lifespan Development by Lumen Learning is licensed under CC BY 4.0 ↵
- From Lumenlearning, Introduction to Psychology Module 2: Psychological research is licensed under CC BY SA 4.0 ↵
- From Lumenlearning, Introduction to Psychology Module 2: Psychological research is licensed under CC BY SA 4.0 ↵
- Lifespan Development: A Psychological Perspective 2nd Edition by Martha Lally and Suzanne Valentine-French is licensed under CC BY-NC-SA 3.0 (modified by Maria Pagano) ↵
- From Lumenlearning, Introduction to Psychology Module 2: Psychological research is licensed under CC BY SA 4.0 ↵
- From Lumenlearning, Introduction to Psychology Module 2: Psychological research is licensed under CC BY SA 4.0 ↵
- Lifespan Development: A Psychological Perspective 2nd Edition by Martha Lally and Suzanne Valentine-French is licensed under CC BY-NC-SA 3.0 (modified by Maria Pagano) ↵
- Table created by Stangor, C. can be found on Canvas Network and is licensed under CC BY SA 3.0[19] Lifespan Development by Lumen Learning is licensed under CC BY 4.0 (modified by Maria Pagano) ↵
- Image by NOBA is licensed under CC BY-NC-SA 4.0 ↵
- Lifespan Development: A Psychological Perspective 2nd Edition by Martha Lally and Suzanne Valentine-French is licensed under CC BY-NC-SA 3.0 ↵
- Lifespan Development: A Psychological Perspective 2nd Edition by Martha Lally and Suzanne Valentine-French is licensed under CC BY-NC-SA 3.0 ↵
- Lifespan Development: A Psychological Perspective 2nd Edition by Martha Lally and Suzanne Valentine-French is licensed under CC BY-NC-SA 3.0 ↵
- Lifespan Development: A Psychological Perspective 2nd Edition by Martha Lally and Suzanne Valentine-French is licensed under CC BY-NC-SA 3.0[27] Image by NOBA is licensed under CC BY-NC-SA 4.0 ↵
- Fair Use: Image from Perkins School for the Blind eLEARNING ↵
- Research Methods in Developmental Psychology by Angela Lukowski and Helen Milojevich is licensed under CC BY NC SA 4.0 (modified by Maria Pagano ↵
- Infant Visual Habituation by John Colombo and D. Wayne Mitchell Source: U.S. National Library of Medicine. ↵
- Infant Visual Habituation by John Colombo and D. Wayne Mitchell Source: U.S. National Library of Medicine. ↵
- Children’s Development by Ana R. Leon is licensed under CC BY 4.0 ↵
originating in or based on observation or experience; capable of being verified or disproved by observation or experiment empirical laws.
the process of objectively establishing facts through testing and experimentation.
a testable statement about the relationship between two or more variables
A set of supported hypotheses that have been tested using empirical facts and is used to predict, explain, and understand behaviors.
the possibility that an assertion, hypothesis, or theory can be shown to be false by an observation or experiment.
involves asking broader research questions, collecting more detailed data (e.g., interviews), and using nonstatistical analyses.
involves the statistical and mathematical modeling of psychological processes, the design of research studies and the analysis of psychological data.
the overall strategy that you choose to integrate the different components of the study in a coherent and logical way, thereby, ensuring you will effectively address the research problem; it constitutes the blueprint for the collection, measurement, and analysis of data.
a type of research that is used to describe the characteristics of a population. It collects data that are used to answer a wide range of what, when, and how questions pertaining to a particular population or group.
a statistical measure that expresses the extent to which two variables are linearly related (meaning they change together at a constant rate). It's a common tool for describing simple relationships without making a statement about cause and effect.
research conducted using the scientific approach that determines a cause and effect relationship.
A case study has also been described as an intensive, systematic investigation of a single individual, group, community or some other unit in which the researcher examines in-depth data relating to several variables.
several different types of non-experimental studies in which behavior is systematically observed and recorded;a method that involves observing subjects in their natural environment/
a research method used for collecting data from a predefined group of respondents to gain information and insights into various topics of interest
a method of conversation with a specified purpose. Psychologists uses interview method in order to gain information in an efficient and streamlined manner; Interviews can be structured, unstructured or a combination of both structured and unstructured
involves recording and quantifying various physiological responses in controlled conditions using electromechanical equipment (e.g., electromyography, electroencephalography, electrodermal activity, respiratory activity, electrocardiography).
a research tool used to determine the presence of certain words, themes, or concepts within some given qualitative data (i.e. text); research that involves searching for and extracting information and evidence from original archives. Archives are historical – non-current – documents, records and other sources relating to the activities and claims of individuals, entities or both.
a file containing relevant information pertaining to an individual client or group.
a method that involves observing subjects in their natural environment.
the extent to which findings (from a study) can be generalized (or extended) to the those in natural settings (i.e., outside the lab)
a systematic method of collecting behavioral data within a controlled environment, often used in research with infants and young children, in which observers measure overt actions and interpersonal processes.
occurs when a researcher's expectations, opinions, or prejudices influence what they perceive or record in a study
the degree to which different raters or judges make consistent estimates of the same phenomenon
a format for question responses that requires respondents to provide an answer (e.g., yes or no), forcing them to make judgments about each response option
a type of interview in which the interviewer asks only a few predefined questions while the rest of the questions are not planned in advance
physiological responses of human body to psychological manipulations
the measured brain response that is the direct result of a specific sensory, cognitive, or motor event.
an instrument used to record electrical activity in the brain and other tissue
a statistical measure of the strength of the relationship between the relative movements of two variables; the values range between -1.0 and 1.0
a visual representation of the relationships or between two numerical variables, which are represented as points plotted at a horizontal axis (y-axis) and vertical axis (y-axis).
a relationship between two variables in which both variables move in the same direction; as one variable increases the other variable increases, or as one variable decreases the other variable decreases.
a relationship between two variables in which an increase in one variable is associated with a decrease in the other
any variable that you're not investigating that can potentially affect the dependent variable of your research study
the variable that is manipulated by the experimenter
the variable that is measured by the experimenter
a group of participants in a research study who are exposed to a particular manipulation of the independent variable
the participants in a study who do not receive the experimental treatment.
a description of something in terms of the operations (procedures, actions, or processes) by which it could be observed and measured.
any systematic errors in the research process or the interpretation of its results that are attributable to a researcher's behavior, preconceived beliefs, expectancies, or desires about results
occurs when the participants are deliberately kept ignorant of the group to which they have been assigned, but the experimenter is aware of which individual is in a particular group.
a study where neither the participants nor the experimenters know who is receiving a particular treatment
when a person's physical or mental health appears to improve after taking a placebo or 'dummy' treatment
the variable that is manipulated/controlled by the experimenter in an experiment.
a person who takes part in a study, or experiment
a subset of individuals randomly selected by researchers to represent the population of interest
how the sample is drawn from the population as a whole
a way of placing participants from your sample into different treatment groups using randomization
looking at data from a population at one specific point in time
the study of a variable or group of variables of the same participants over a period of time, sometimes several years
a mix between cross sectional research and longitudinal research
the effect that having been born at a certain time, or having experienced similar life experiences has on the development of one's perceptions.
a research technique for studying visual discrimination in infants in which the amount of time spent looking at different visual stimuli is measured to determine which stimulus the infants prefer
an experimental method in developmental psychology that works under the assumption that an infant will longer at something that he or she prefers over something that he or she does not prefer
a decrease in response to a stimulus after repeated presentations.
the reappearance or enhancement of a habituated response (i.e., one that has been weakened following repeated exposure to the evoking stimulus) due to the presentation of a new stimulus
infants are repeatedly familiarized to a single stimulus for a fixed amount of time and a new stimulus is then presented
looking time is reduced to a criterion level (typically, when the mean looking time over the last three trials is less than 50% of the mean looking time of the first three trials
a group of individuals designated to review and monitor research that involves human subjects
the process where participants in a study are given important information, including possible risks and benefits, about the study
a term used to express willingness to participate in research by persons who are by definition too young to give informed consent but are old enough to understand the proposed research
