87 Field data support
Good reference for the ice drilling:
A brief history of ice core science over the last 50 yr
J. Jouzel, Clim. Past, 9, 2525–2547, 2013
https://cp.copernicus.org/articles/9/2525/2013/cp-9-2525-2013.pdf
The first drilling project: Russian station Vostok (“East”); 1957 – present, depth 3770 m.

Map source: Talalay, Pavel & Markov, A.. (2015). Thermobaric Conditions at Ice-Water Interface in Subglacial Lake Vostok, East Antarctica. Natural Resources. 06. 423-432. 10.4236/nr.2015.66040.
Ice data confirmed existence of historical cycles of climatic variations. They consist of glacial and interglacial periods.

Source: https://www.antarcticglaciers.org/glaciers-and-climate/ice-cores/ice-core-basics/
Ice drilling (Greenland), from the film “Scientist and Eemian” (by Yuri Gorokhovich, 2003)
Start from 7:00
Data! Data! Data!
Various data from the field provide so-called proxies for the temperature because we can’t measure it directly back in time.
Climate data depository:
https://gis.ncdc.noaa.gov/maps/ncei/paleo?layers=00001
Any climate change skeptic and denier can go there and check the facts!
Are you ready? Or better to go on YouTube or Twitter for the “fast food”?
How are past temperatures determined from an ice core?
https://www.scientificamerican.com/article/how-are-past-temperatures/
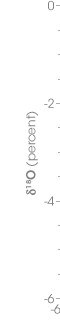
Oxygen Isotopes:

The standard (from Wikipedia): Vienna Standard Mean Ocean Water (VSMOW) is an isotopic standard for water, that is, a particular sample of water whose proportions of different isotopes of hydrogen and oxygen are accurately known. VSMOW is distilled from ocean water and does not contain salt or other impurities. Published and distributed by the Vienna-based International Atomic Energy Agency in 1968, the standard and its essentially identical successor, VSMOW2, continue to be used as a reference material.
When water vapors from equator (warming) reach poles, 18O depletes; this reduces delta-18O; reduction in delta-18O means increase in the temperature, i.e. warming.
A positive delta-18O value means that the sample contains more of the heavy isotope than the standard; a negative value means that the sample contains less of the heavy isotope than the standard.
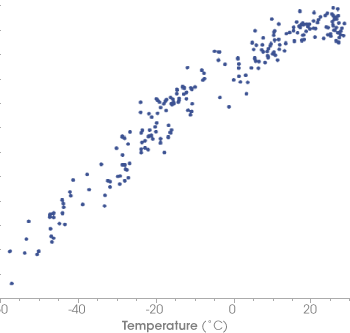
The concentration of 18O in precipitation decreases with temperature.
Use of cave deposits
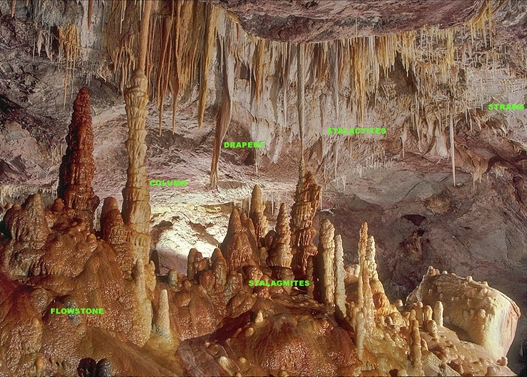
The principal proxies measured are oxygen and carbon isotopes and trace cations.
Speleothem transects can provide paleoclimate records similar to those from ice cores or tree rings.[4] Slow geometrical growth and incorporation of radioactive elements enables speleothems to be accurately and precisely dated over much of the late Quaternary by radiocarbon dating and uranium-thorium dating, as long as the cave is a closed system and the speleothem has not undergone recrystallization.[5] Oxygen (δ18O) and carbon (δ13C) stable isotopes are used to track variation in rainfall temperature, precipitation, and vegetation changes over the past ~500,000 years.[6][7] Variations in precipitation alter the width of speleothem rings: closed rings indicates little rainfall, wider spacing indicates heavier rainfall, and denser rings indicate higher moisture. Drip rate counting and trace element analysis of the water drops record short-term climate variations, such as El Niño–Southern Oscillation (ENSO) climate events.[8]
Source: https://en.wikipedia.org/wiki/Speleothem#As_climate_proxies
Historical data from the ocean floor
The most complete 5,200 thousands years record on climatic variations today from benthic organisms.
“Real” variation in data or data modeling artifacts?
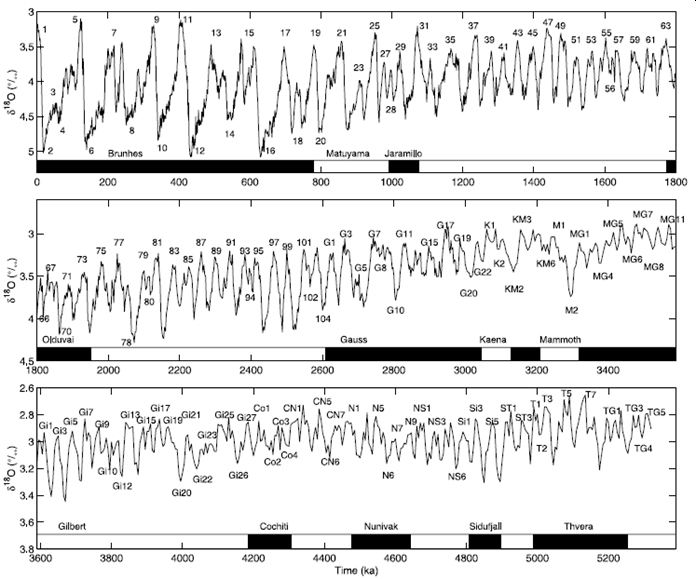
Source: Lisiecki, L. E., and M. E. Raymo (2005), A Pliocene-Pleistocene stack of 57 globally distributed benthic δ18O records, Paleoceanography, 20, PA1003; (cited 2,358 times)
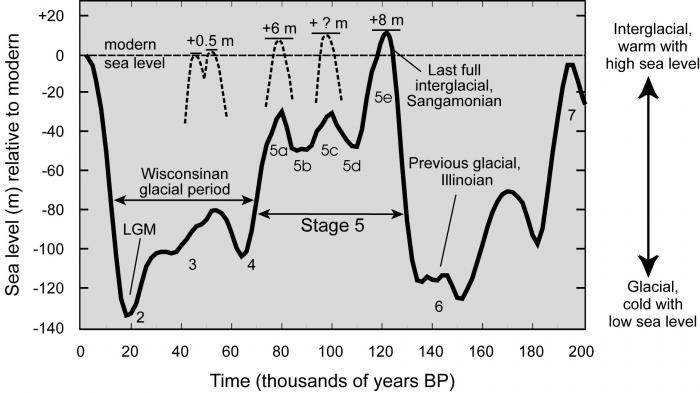
Let’s zoom in: sea level in the past 200,000 years; do you see anything interesting?
Sangamonian interglacial, is also known as Eemian; characterized by the high sea-level rise 120,000 years ago; no industry or humans at that time and CO2 concentration was about 300 ppm.
Source: https://www.e-education.psu.edu/earth107/node/1496
