65 Human Impact: stream discharge, hydrograph, floods
Stream Discharge and Hydrograph
Stream discharge is the volume of water that passes through a given cross section per unit time:
Q = V * A,
where
Q = stream discharge (for example, cubic feet per second or cubic meters per second)
V = velocity, feet per second or meters per second
A = cross-sectional area, square feet or square meters.
To measure discharge hydrologists build gage stations to ensure the stability of cross-sectional area for calculations. Below is an example of a typical engineered gage station in England. It consist of weir (concrete structure through which water passes) and recording gauges (green posts).

Brant Broughton Gauging Station on the River Brant in Lincolnshire, England.
(Attribution: Richard Croft, https://en.wikipedia.org/wiki/Stream_gauge#/media/File:Brant_Broughton_Gauging_Station_-_geograph.org.uk_-_166904.jpg)
Data collected by gauges helps creating hydrographs: graphs depicting relationship between water discharge and time.
Below is an example of the hydrograph from: https://www.bbc.co.uk/scotland/education/int/geog/rivers/hydrographs/index.shtml

Floods and Land Cover Impact
Streams flood. Flooding is a normal part of stream behavior. The rate at which streams erode, transport, and deposit sediments greatly increases during flooding. A flood occurs when the water depth in a stream exceeds the depth of the stream channel and spreads beyond the stream channel onto the surrounding land. When a stream completely fills its channel it is said to be at bankfull stage. When a stream surpasses bankfull stage it is said to be in flood. When the flood spreads widely enough to cause property damage, a stream is said to be at flood stage.
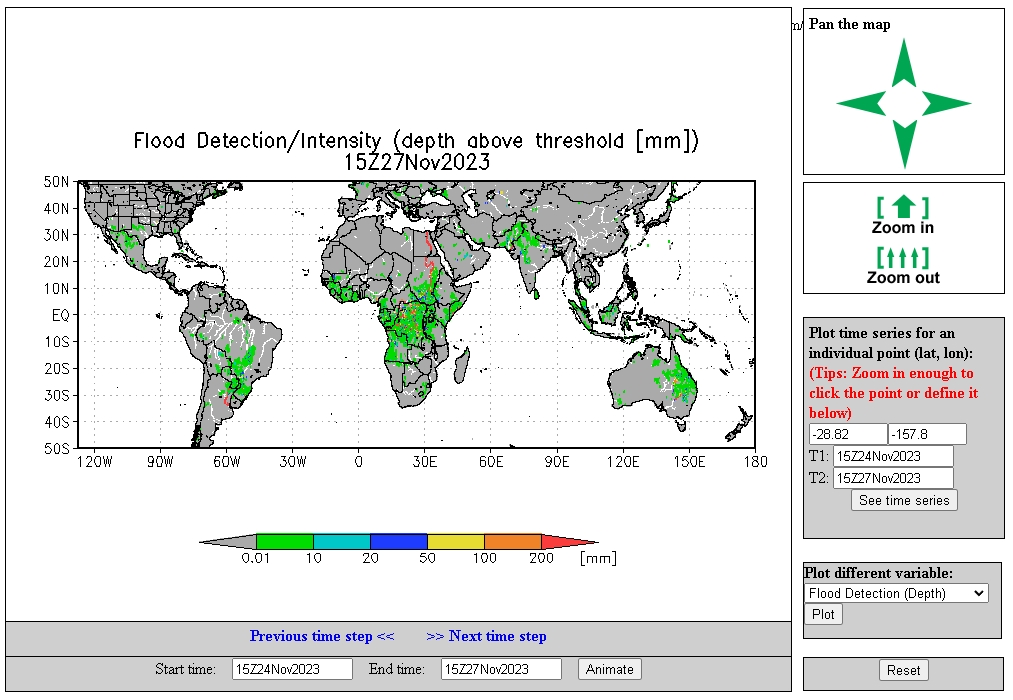
Satellite data and scientific analysis help to create global flood monitoring systems: http://flood.umd.edu
These graphs show the most general concept of flood occurrence: the strongest floods occur less often than weak or moderate floods. Flood forecasts are determined by examining past occurrences of flooding events, determining recurrence intervals of historical events, and then extrapolating to future probabilities.
 Source: https://www.slideshare.net/vivek6002/flood-frequency-analyses
Based on recurrence intervals we call floods 100-year flood, 50-year flood, etc.
The determination of recurrence intervals has many inherent assumptions that are often false. One assumption is that each flood event is independent of previous flooding events, which is often false. Another assumption is that the occurrences and recurrence intervals of floods in the past is the same as the occurrences in the future. Because drainage basins are changed by human activities and other events, and rainfall may be changing due to local or global climate variations, the extrapolation of past events to the future may be invalid.
FLASH FLOODS: a specific type of flood with very fast increase of the water discharge. Occurs in ephemeral streams, arroyo, dry canyons and also in some urban areas (because of poor maintenance and design of drainage system)..
Land Cover Impact
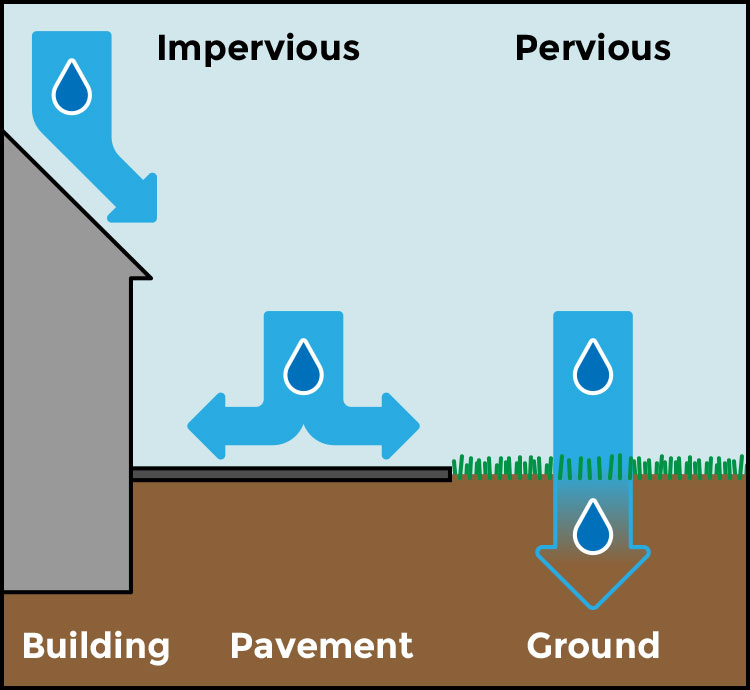
Changes to the land in the drainage area of a stream, such as the addition of buildings and roads, can change how a stream floods. Buildings and pavement that cover the ground prevent or reduce infiltration and cause increased surface run off. Increased stream runoff means smaller amount of rain will cause the stream to reach flood stage than before the alterations to the land. The stream will flood more frequently. For the same amount and rate of rainfall that caused flooding prior to building, the stream will reach flood stage quicker and the flood will be deeper.
Take a look at the photo below. You see that water concentrates over the concrete pavement and nearby lawn areas are not flooded. This occurs because lawn cover is pemeable and concrete pavement is impermeable. Concentrated water flows fill up drains and can cause urban flooding if not cleaned and well maintained.

Examples of permeable land cover surfaces: lawns, parks, grass fields, pastures, etc.
Examples of impermeable land cover surfaces: parking lots, buildings, roofs, etc.
 Source: https://richlandswcd.net/services/water/impervious-areas
INCREASE IN URBANIZATION LEADS TO HIGHER WATER DISCHARGES FROM VARIOUS SURFACES AND INCREASE IN FLOODS IF NO ADDITIONAL DRAINS ARE BUILD AND MAINTAINED
The diagram below shows the flood response of a stream to a given amount of rainfall before and after the stream drainage area was urbanized by removal of forest and addition of buildings and roads. After urbanization, the stream reaches its peak flood level quicker and rises to a higher level than before urbanization. Unless countermeasures are engineered and installed, an urbanized area will flood more frequently and severely than the same area when it was forested.
Example below shows how changes in land cover for more than 100 years caused an abnormal (greater than 100-year) flood on April 18,1997 in Fargo, ND.
 Source: https://pubs.usgs.gov/fs/FS-229-96/
Example below shows how building of Howard Hanson Dam on the Green River (WA) change flood occurence. Dam management helps to control water flow (discharge) by increasing or decreasing water level.
 Source: https://pubs.usgs.gov/fs/FS-229-96/
Example below shows changes in hydrograph caused by rapid urban development in the Mercer Creek Basin (WA) since 1977. Because of increase in impervious surfaces drainage area of the basin produces more discharge and consequently more strong floods.
 Source: https://pubs.usgs.gov/fs/FS-229-96/
Streamflow data that have been collected since 1975 on the Chehalis River near Doty (WA) indicate that the estimated streamflow of “1-in-100 chance flood” is higher than it was 20 years ago. The earlier flood designation was accurate on the basis of the data that were available at the time; more large floods happened after 1975 than from 1940-1975. The change in the flood designation after 20 years of additional data collection highlights the importance of continued river monitoring.
 Source: https://pubs.usgs.gov/fs/FS-229-96/
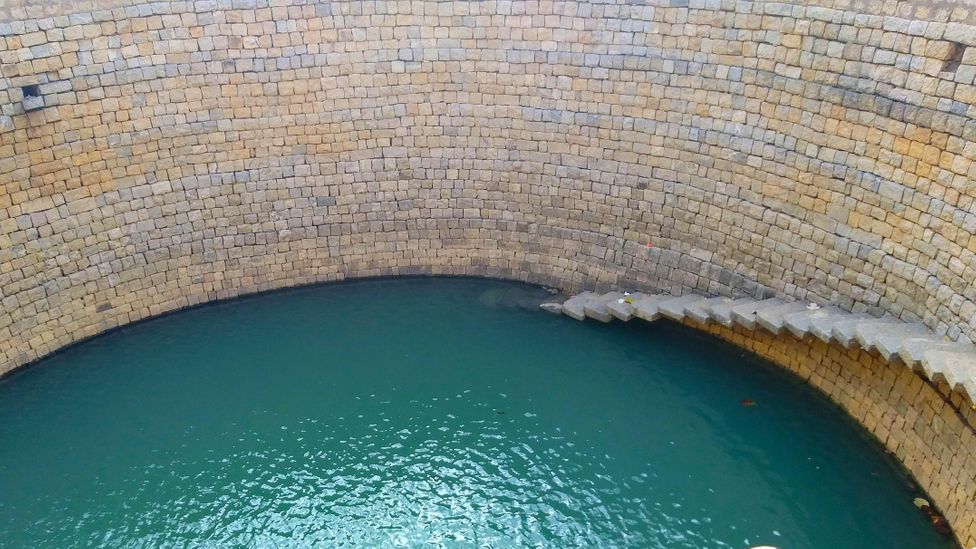
The Indian megacity digging a million wells
https://www.bbc.com/future/article/20201006-india-why-bangalore-is-digging-a-million-wells
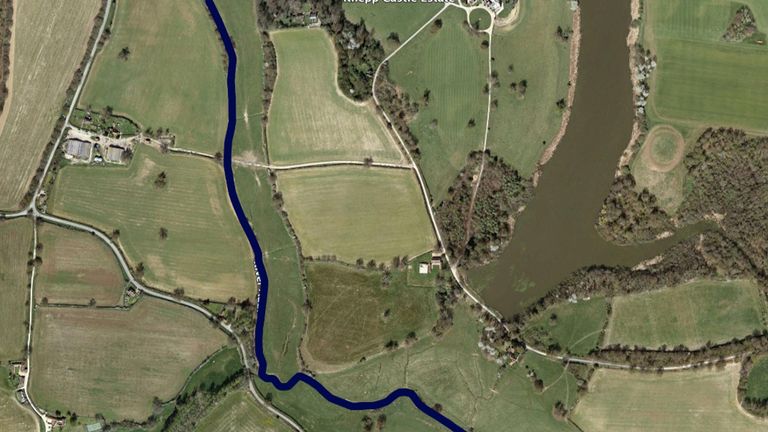
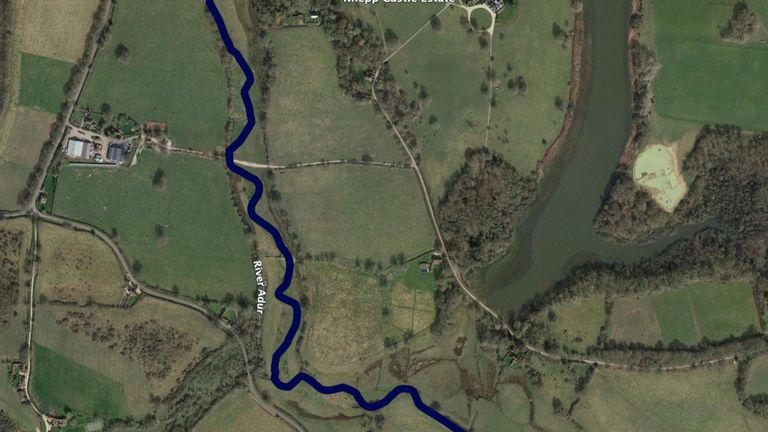
Should we start bringing river channels back to their natural shapes to avoid floods?
https://news.sky.com/story/could-making-rivers-bendy-again-help-prevent-flooding-13047000
Mississippi River History & Flood Management by USACE:
Balkan dam boom: Saving the Blue Heart of Europe
