117 Where are we now ?
Science:
-
More certain than before about anthropogenic causes of climate change
-
Global data gathering continues from satellites and field campaigns
-
New methods and ideas cause reanalysis of existing data
-
Stronger link with social and political science
-
Having hard time to translate scientific information into the plain language for decision makers and politicians!
Education:
-
Too much on “polar bears” and too little on local and scientific issues (e.g. many students do not know how do we measure proxies or use satellites, how climate change affect local area, etc.)
-
Public lacks education about the Earth history and cyclicity of its natural processes, such as volcanic eruptions that caused massive extinctions in the past and/or glacial cycles that caused higher sea-level rises than we have now (e.g. Sangamon/ Eemian), etc.
Society:
-
Subdivided (skeptics, alarmists, deniers, etc.); like now with Covid vaccines;
-
Does not notice two scales of Earth history: earth evolution with its thousands and millions years and last 140 years since Great Technological Revolution; as a result we are unable to reason on decision making.
-
Opportunistic (drive for funding, careers, finger-pointing, etc.); slows down the progress and deviates the course of actions.
-
Economical benefits usually outweigh environmental concerns; people need jobs; economists and politicians are paranoid with economic growth indicators; as result we have disproportional exploitations of natural resources and as a result wealth distribution that further divides society and hampers decision making process.
-
People are not ready to change habits (I am hot and need my air conditioner RIGHT NOW! Where is my ice machine? My apartment is so cold! Let’s throw the party and also throw a lot of food and plastics in the garbage! etc.)
Societal response: let’s create a committee!!!!!
Awareness and assessment!
Most findings in IPCC reports were already published in 1948 paper by Ahlmann.
Congratulations! We are behind by more than 40 years!
Who are IPCC contributors?
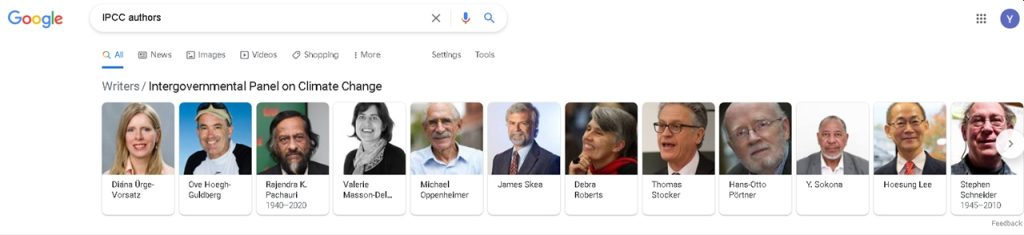
Physics, environmental science: https://en.wikipedia.org/wiki/Diana_%C3%9Crge-Vorsatz
Biologist, climate scientist: https://en.wikipedia.org/wiki/Ove_Hoegh-Guldberg_(biologist)
Industrial Engineering in and economics: https://en.wikipedia.org/wiki/Rajendra_K._Pachauri
Engineering, fluid physics: https://en.wikipedia.org/wiki/Valerie_Masson-Delmotte
Atomic, Molecular Astrophysics: https://en.wikipedia.org/wiki/Michael_Oppenheimer
Policy studies, sustainable energy: https://en.wikipedia.org/wiki/James_Skea
Sustainability, environmental planning, Climate Protection: https://en.wikipedia.org/wiki/Debra_Roberts
Physics: https://en.wikipedia.org/wiki/Thomas_Stocker
Marine animals, ecosystems
Sustainable development
Economist, environmental policy: https://en.wikipedia.org/wiki/Hoesung_Lee
Environmental biology, modeling climate change: https://en.wikipedia.org/wiki/Stephen_Schneider
ANY GEOLOGIST IN THE LIST? HELLO?
IPCC main findings:
-
UN report found that shutdown of conveyor belt current (thermohaline circulation in oceans) has occurred historically, but there is no evidence that it will occur again any time soon.
-
There is sufficient evidence (in IPCC report) to state that::
-
There is widespread evidence of human influence on global climate.
-
Warming is now occurring.
-
Mean surface temperature of Earth will likely increase between 1.80 and 40 C (30 and 70 F) during this, i.e. 21st century.
-
Different Views on Global Warming: http://www.npr.org/templates/story/story.php?storyId=1893089


Penn State Glaciologist Richard Alley;
University of Alabama in Huntsville Climatologist John Christy;
Columbia University Oceanographer Wallace Broecker
Latest Climate Summit, Dec 2023 in Dubai: https://en.wikipedia.org/wiki/2023_United_Nations_Climate_Change_Conference

Sultan Al Jaber, right, president of COP28, at the summit early on Wednesday.
Past U.N. climate deals have shied away from mentioning the words “fossil fuels.”Credit…Kamran Jebreili/Associated Press
“Humanity has finally done what is long, long, long overdue,” said Wopke Hoekstra, the European commissioner for climate action. “Thirty years — 30 years! — we spent to arrive at the beginning of the end of fossil fuels.”
The new deal is not legally binding and can’t, on its own, force any country to act. Yet many of the politicians, environmentalists and business leaders gathered in Dubai hoped it would send a message to investors and policymakers that the shift away from fossil fuels was unstoppable. Over the next two years, each nation is supposed to submit a detailed, formal plan for how it intends to curb greenhouse gas emissions through 2035. Wednesday’s agreement is meant to guide those plans. (from NYT, https://www.nytimes.com/2023/12/13/climate/cop28-climate-agreement.html)
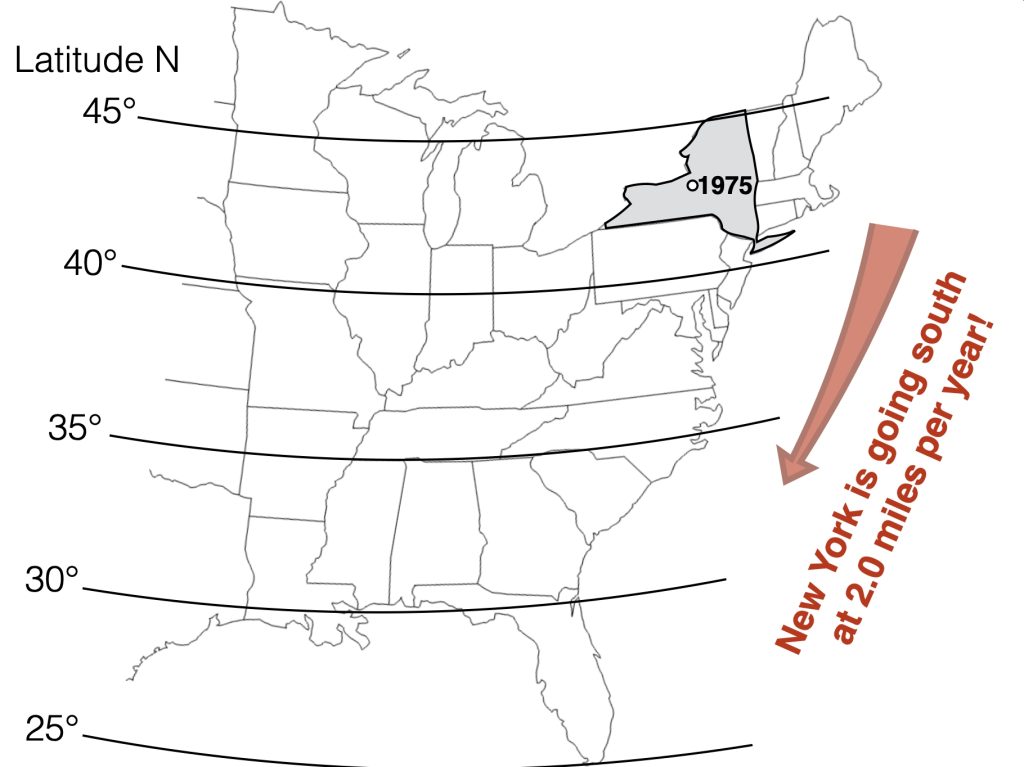
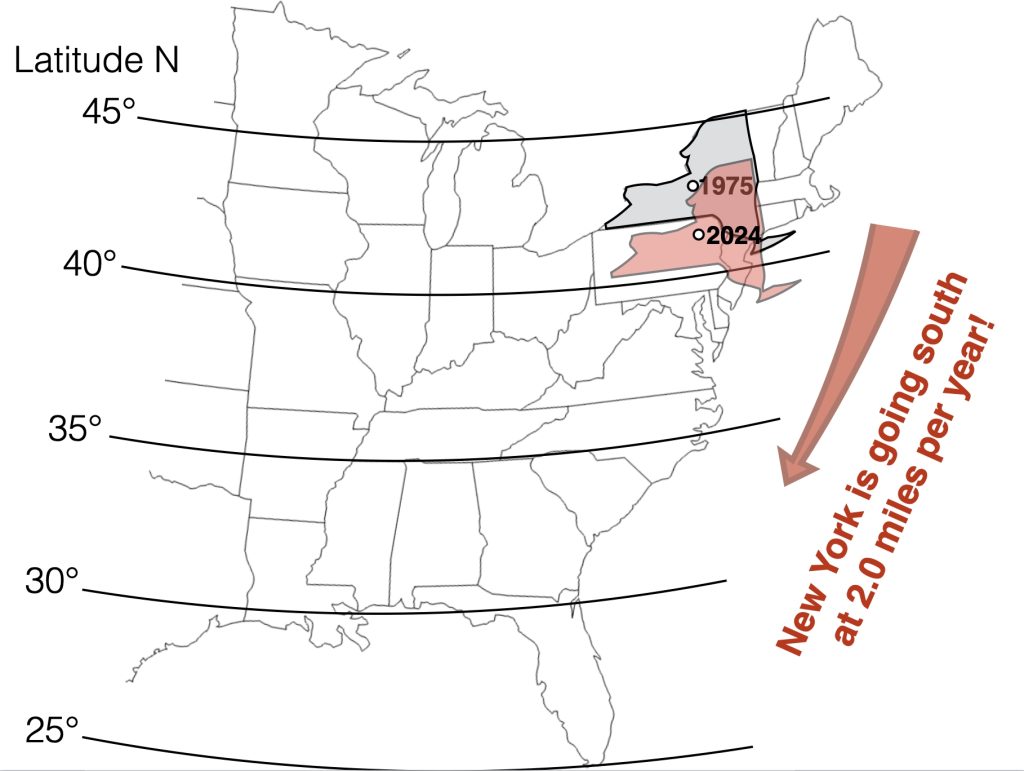
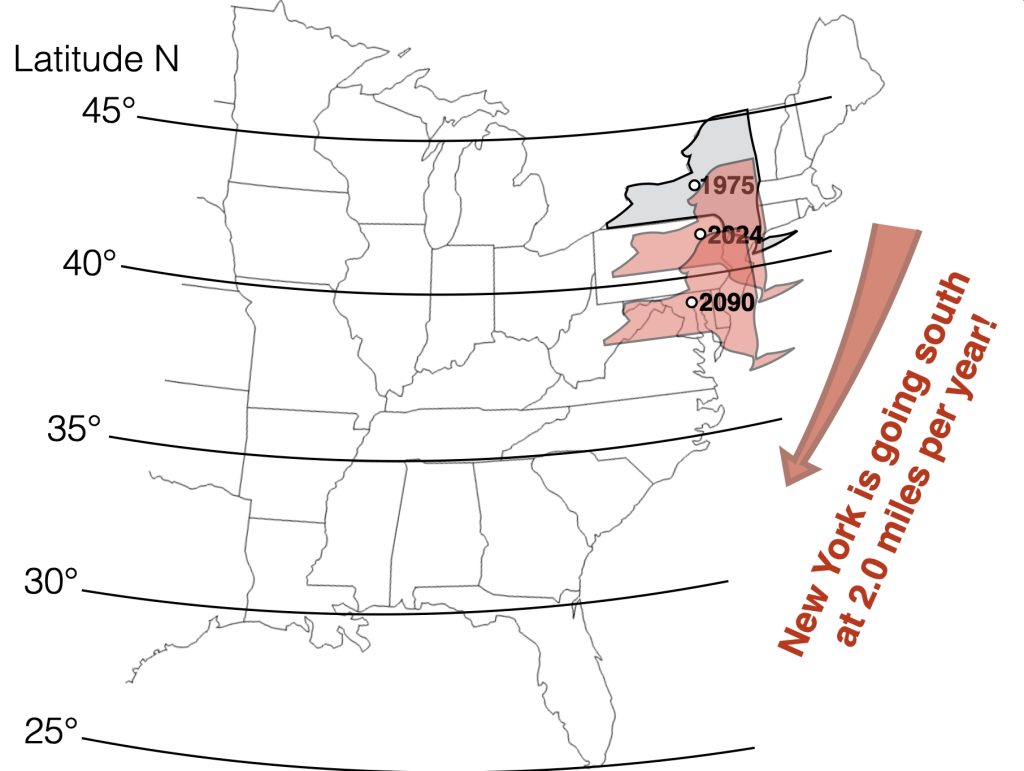
What’s going on in New York?
The New York State Climate Impacts Assessment has just announced publication of new projections for how New York’s climate could change in the future: https://nysclimateimpacts.org/ . These projections use the same climate models that are used in the latest IPCC (Intergovernmental Panel on Climate Change) report.

Dr. Bryce Hand, Emeritus Professor of Geology, Syracuse University, created graphical depiction of the New York State influenced by the climate change. Below, in his own words: