11 Employment, Unemployment and How They Are Measured
Bettina Berch
Consider this…
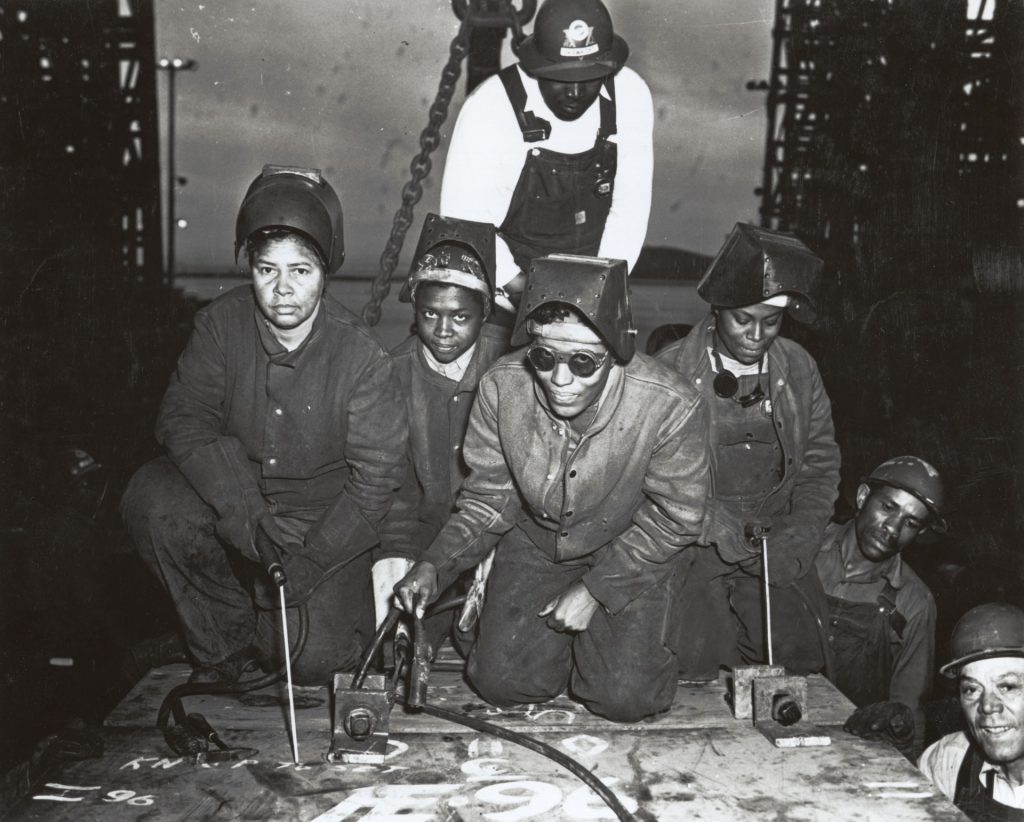
Big social/cultural changes can impact labor force participation rates, which we will examine in this chapter. What social change led these women to pick up welding gear? Have you ever heard people talk about African-American ‘Rosie the Riveters’?
Discussing employment and unemployment involves a lot of talking about numbers, but the experience of unemployment is about more than these numbers, about more than lost paychecks–it can also involve our self-respect, our sense of accomplishing things in this world, and our ability to relate to others. Watch this former Poet Laureate of the United States, Philip Levine, reading his poem, “What Work Is.” Sometimes poetry tells it so much better than economics ever can!
How Are Employment, Unemployment, and the Labor Force defined?
Keeping the human dimension in mind, let’s look at how unemployment is defined (which is different from how people talk about being ‘out of work’). For economists, people are unemployed if they do not have a job, are able to work, and are actively searching for work. All three conditions must be satisfied! You can break down that definition with a flow chart like this, if it makes it simpler:
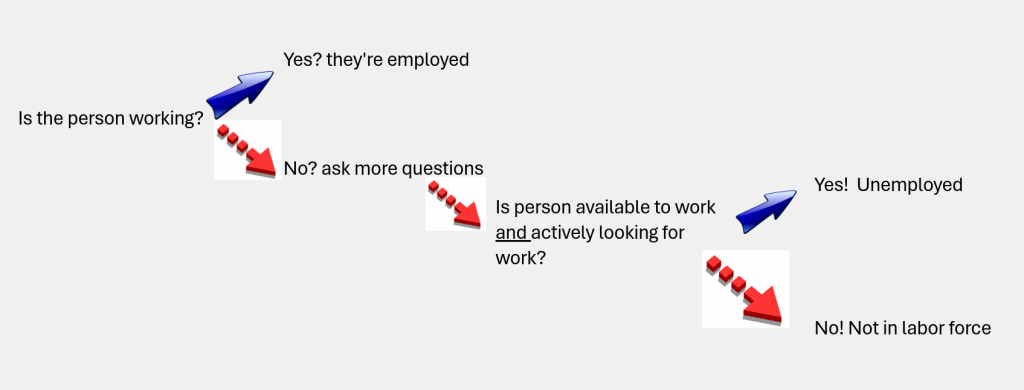
Let’s consider the other possibilities. If people have jobs, they are employed, whether they like the job or not, whether it’s giving them the hours they want or not. If people don’t have jobs, but they are not actually available to work–maybe they have to care for someone at home– they are not in the labor force. If people don’t have jobs but they are not actively looking for jobs–maybe they have gotten discouraged after searching for so long–they, too, are not in the labor force. It might seem like these definitions are overly picky, but the distinctions are useful for guiding economic policy. If you worked for the BLS (Bureau of Labor Statistics), and you had to focus your time and energy on one group, which would you pick? You might want to start with people who were available to take jobs and were actively looking for work, since you could be most productive, fastest.
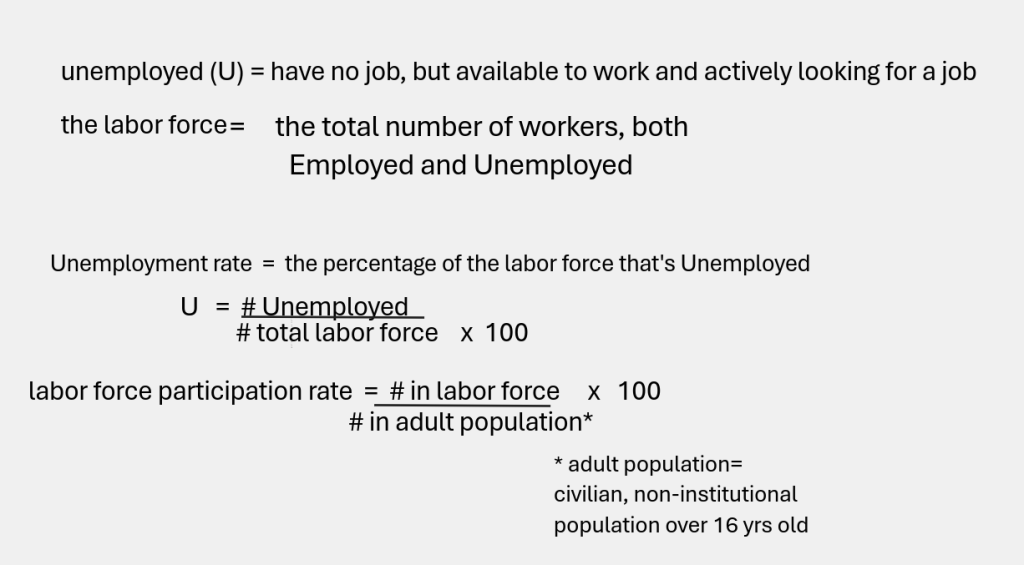
Central to labor market analysis is another complicated term, the labor force participation rate, LFPR, defined as the percentage of the adult population that’s in the labor force. How do we figure that out? Start with adult population, defined as the civilian (non-military), non-institutional (not in hospitals or incarcerated) population over 16 year old. The labor force is defined as the number of people who are employed plus the number unemployed. Putting all these terms together, we get a definition of the labor force participation rate:
labor force participation rate (LFPR) = (the number of people in the labor force / the number of people in adult population) x 100.
the unemployment rate = the number of unemployed / the number in total labor force (expressed as percentage)
You might be wondering, why there are so many different terms? Wouldn’t it be enough just to look at the unemployment rate? If the unemployment rate goes up we are unhappy and if it goes down we are happy, right? No, not so fast. Suppose someone was unemployed (remember: no job, but actively looking for work). Suppose they finally got discouraged, and quit looking for work. In this case, the unemployment rate would go down, because there are fewer people unemployed. This would be bad news–even though there’s a drop in the Unemployment rate! How do we sort this out?
Let’s remember that the good news we really want, is for our unemployed person to actually get a job. This would drop the unemployment rate AND the labor force participation rate would stay constant, since our job-seeker would be staying in the labor force, just switching from Unemployed to Employed. This is why we always get LFPR data at the same time as data on the unemployment rate. That labor force participation rate gives us a handle on whether our Unemployed are leaving the labor force altogether, or whether they are staying in the game and getting jobs.
Who is More Likely to Be Unemployed in the U.S. Economy?
Now that we know how employment, unemployment and labor force participation rates are defined, it’s time to look at the numbers. We need to know what groups in the U.S. are more likely to experience unemployment, before we can understand why. The data is collected by the Bureau of Labor Statistics (BLS), and they have their own categories. They use only two sexes–male and female. They routinely gather data on people identified as white, Black or African American, and Asian. They break-out 16-19 year olds, and people 20 years of age and up. From time to time, they offer data on people they term Hispanic, but they do not have breakdowns for people with multiple identities. They also issue special reports on subsets of the population. Let’s look at BLS figures for October 2023, compared to a year before, October 2022, using seasonally adjusted figures, since they are available.
| Employment Status | October 2022 | October 2023 |
| Labor force participation rate, white workers | 62.0 | 62.3 |
| unemployment rate, white male, over 20 yrs | 3.0 | 3.4 |
| unemployment rate, white female, over 20 yrs | 3.0 | 2.8 |
| unemployment rate, white male and female, 16-19 yrs old | 9.6 | 12.2 |
| Labor force participation rate, Black or African-American workers | 62.1 | 62.9 |
| unemployment rate, Black male, over 20 | 5.3 | 5.3 |
| unemployment rate, Black female, over 20 | 5.8 | 5.3 |
| unemployment rate, Black 16-19 yrs old | 16.7 | 18.8 |
| unemployment rate, all Asian workers | 2.9 | 3.1 |
| Labor force participation rate, Asian workers | 64.8 | 65.3 |
We see that the labor force participation rate for whites and Blacks is fairly similar, around 62%, with Asians a few points higher. Asian workers have relatively low unemployment rates, averaging 3%, which is similar to white workers. Black people experience higher unemployment rates than whites, in some cases almost twice the white rate.
What really jumps out here is the unemployment rate for 16-19 year olds, which was 12.2% for white teens and 18.8% for black teens! Almost 1 in 5 black teenagers is unemployed. Keep in mind, we are not talking about ‘lazy kids who can’t be bothered’ or ‘teens with attitude.’–remember the definitions. To be classified as unemployed, these teens had to prove they were applying to a certain number of appropriate job openings a week, and getting turned down. So, race matters. Age matters. Gender matters too, but not in ways we can notice from this breakdown of the numbers.
Trends over Time
When we look at graphs of employment data over time, we can spot certain trends. First, let’s look at labor force participation rates in the U.S. over time:
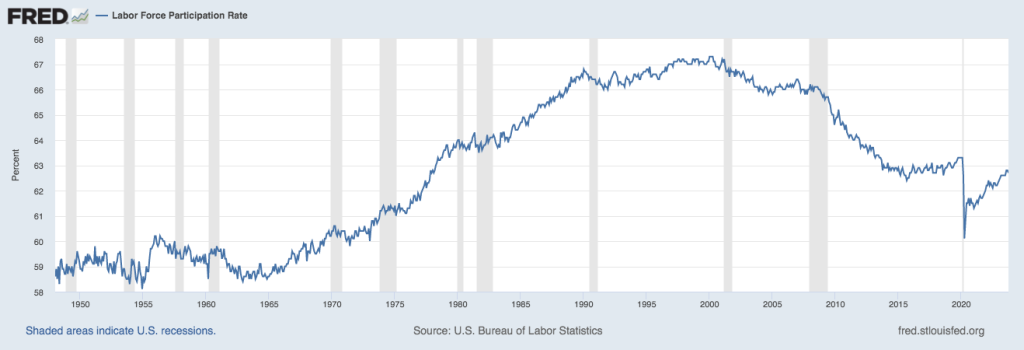
The grey vertical bars indicate periods of economic recession, and generally we see a fall in labor force participation in those periods. (When no one’s hiring, people quit looking for jobs, meaning LFPR go down.) Around 2020, you see a big drop due to the COVID pandemic. But the bigger story is the gradual increase of our LFPR over the course of the twentieth century. In the 21st century, we see a marked decline in LFPR, probably due to people working for themselves–the ‘gig’ economy.
Unemployment rates also track recessions in the economy, with unemployment rates jumping up with every recession.
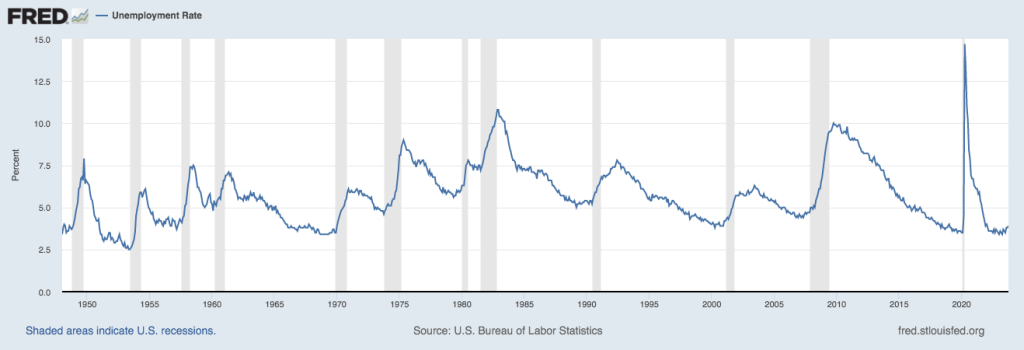
We also see a marked increase for the 2008 recession and a high spike for the Covid period. When we looked at unemployment data for 2023 in the table above, we noticed that youth 16-19 years old suffered the highest rates of unemployment, with Black or African American youth having the highest rates. We can look at those numbers for the period after 2000:
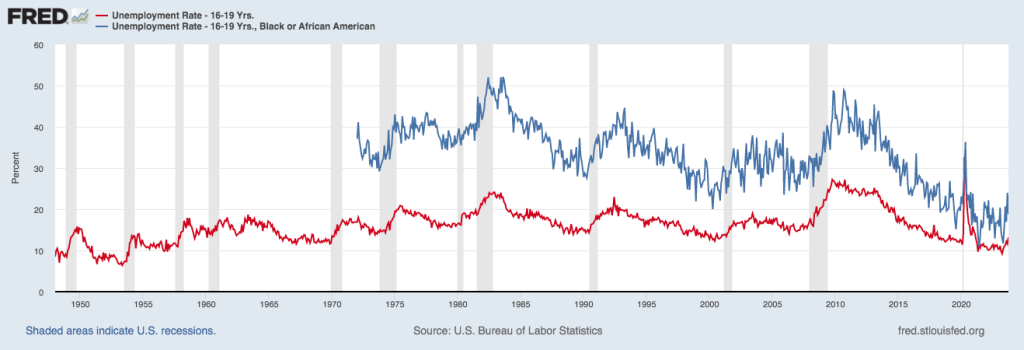
The lower, red line shows unemployment rates for all 16-19 year olds, and the blue line above breaks out the rate for Black teens, which is consistently higher. Sometimes, so much data seems overwhelming…and then you hit upon some numbers that really make their own point! Consider this data on the employment of people with disabilities in the U.S. economy:
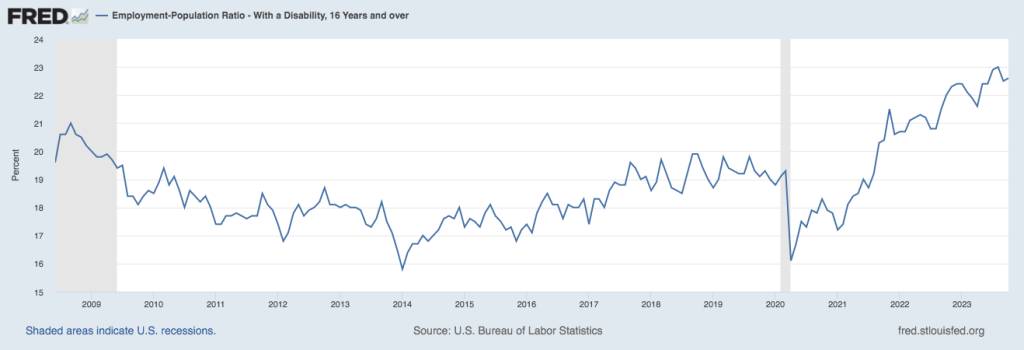
Like all workers, there’s a big drop in employment during Covid. But look at what happens after Covid! The employment of people with disabilities charts a steady but strong upward trend. Why? Think about remote work. The rise of remote work makes it possible for a lot more workers–people with disabilities, people care-giving in the home, people living outside urban areas–to enter gainful employment.
Why are any people Unemployed?
Normally, in any kind of market, we have a supply curve and a demand curve intersecting at some price and quantity that leaves suppliers and demanders satisfied. In a labor market, we would expect that the demand for labor and the supply of labor would intersect at some equilibrium wage, where employers could hire the workers they needed and workers could get the jobs they wanted. But what we saw when we looked at the impact of price controls in a market, is that a binding price ceiling or price floor could mean quantity supplied no longer equaled quantity demanded. Let’s remember how that looks:
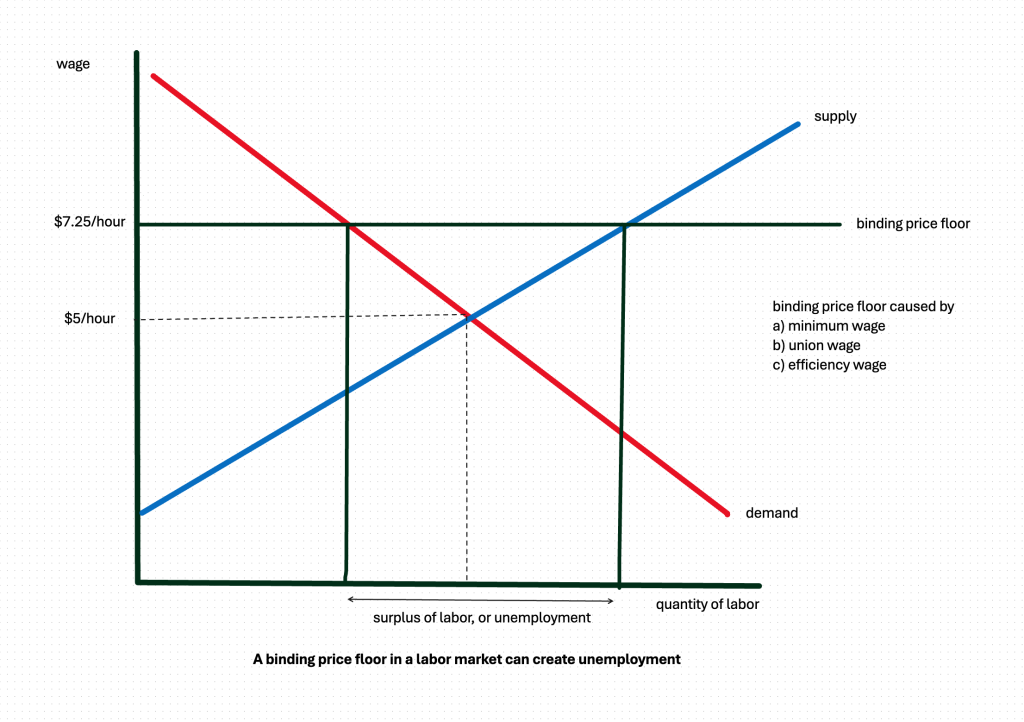
Here, a binding price floor in a labor market could produce a surplus of labor, or what we call ‘unemployment.’ What could explain this binding price floor?
A binding price floor caused by the minimum wage
Thinking about the high youth unemployment rates in our country, the minimum wage comes to mind. Typically, minimum wage jobs go to people who have no job experience, no skill training, and no higher education–which describes our 16-19 year old job seekers, who have just left high school. Employers might decide that paying these unskilled teens the $15/hour minimum wage is not worth it, when they can buy point-of-sale (POS) software that customers can input themselves.
A binding price floor caused by the union wage
When we join a union at work, there can be many reasons. In rare cases, it’s automatic; all workers are automatically part of the union bargaining group. When it’s voluntary, we join a union to get better health and safety regulation, protection against unfair dismissal, and other workplace quality of life benefits. We also join unions because unions can get us higher wages than we’d have without a union, now estimated at 18% higher. When a unionized workplace is paying 18% higher wages than a non-union shop, this could explain a binding price floor in those sectors.
A binding price floor caused by an ‘efficiency wage’
There are certain employers who are known to pay ‘above market’ wages with lots of extras–think of Google, for example. While they are secretive about their actual wages, people compete hard for their jobs, one sign that they pay more than the rest of the market. Or consider the example given by Janet Yellen, former head of the Federal Reserve, followed by her role as U.S. Treasury Secretary. She and her husband, George Akerlof, are both great economists. When she went back to work after giving birth, Yellen said she was determined to pay over-market wages to their nanny. When people were scandalized at the idea of economists paying more than they had to for anything, she explained: “It’s a completely rational reason to pay someone more, especially if the job is some of the most intimate work there is, which is caring for children,” Yellen said. “Our hypothesis proved correct, at least in our own home.” Why do some tech companies and some parents (among others) pay wages higher than market equilibrium? It’s efficient! Employers who pay more, may get their pick of the applicant pool. When they hire someone at an obviously above-market rate, this person is not going to spend their time on the job looking for their next job–they know they’re being paid premium wages. This means they are more productive on the job. It also means they are less likely to quit for a better paying job, and worker turnover is expensive. Hiring workers is expensive–advertising, interviewing, looking at resumes, running background checks. There are also costs associated with departing workers, especially if they’re being fired. If it’s the nanny or a home health aide leaving–or any worker with personal attachments–the emotional costs of their departure can be huge. If an employer can pay above market wages, and get the pick of available workers and then retain those workers, that’s efficient. So sometimes in a labor market, that binding wage floor might be an efficiency wage.
Reasons why some groups experience more unemployment than others: discrimination
While a binding wage floor, caused by a minimum wage, a union wage, or an efficiency wage, might account for unemployment for certain groups, like 16-19 year olds, the more obvious explanation for a lot of unemployment is discrimination. Employers might decide they don’t want to hire people of color, women, LGBTQ people, people with disabilities–and this could explain their higher unemployment rates. This seems like what we live through in the real world, so why don’t we start our chapter right there? The reason might be a book, Capitalism and Freedom, published in 1962 by a prize-winning economist, Milton Friedman, of the University of Chicago. Friedman argued that no employer in a competitive market could stay in business discriminating against various groups. Why not? Other employers would hire those higher quality workers the discriminator had refused to hire, and make higher profits, driving the discriminators out of business. Discrimination was un-economic. Friedman’s theory (and that’s all it was) became popular among economists who wanted to argue against government interventions, like anti-discrimination legislation, since he was arguing that a free market would eliminate discriminatory behavior on its own. This was part of a larger ideology that ‘free markets’ promoted all sorts of personal freedoms as well. But there’s a gap between the theory that competitive labor markets should eliminate discriminatory behavior, and the reality that we experience in our lives. Is it bad theory? Or are markets not competitive enough? What we do know, apart from our own experiences of discrimination, is that government actions can have a big impact on labor market experiences. Consider these ‘single unemployed women’ marching for the right to jobs during the Great Depression:
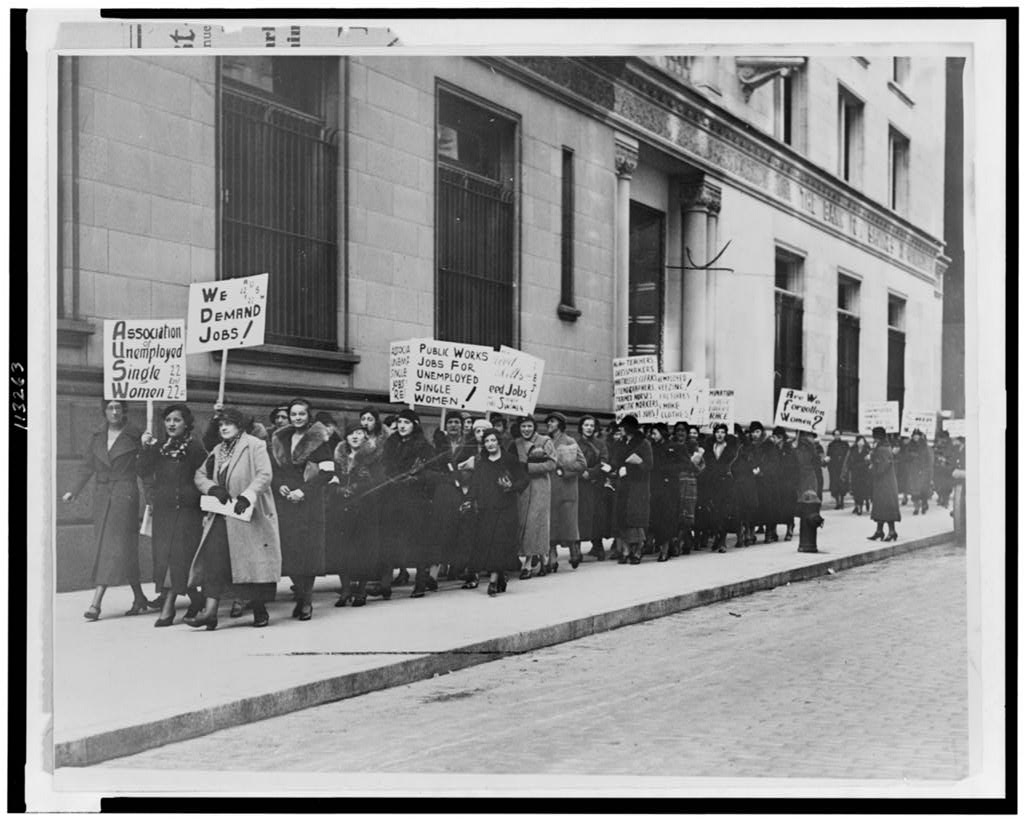
With so many men thrown out of work in the 1930s, prejudice against the hiring of married women rose: one breadwinner per family, and ‘of course’ it should be the husband! Single women were often shut out of relief work programs under the assumption that their ‘families’ could support them. Under the Federal Economy Act of 1932, for example, if married couples worked for the government, the wife would be the first terminated. Decades later, we can see the Congressional Black Caucus working to get legislative support for Black full employment:
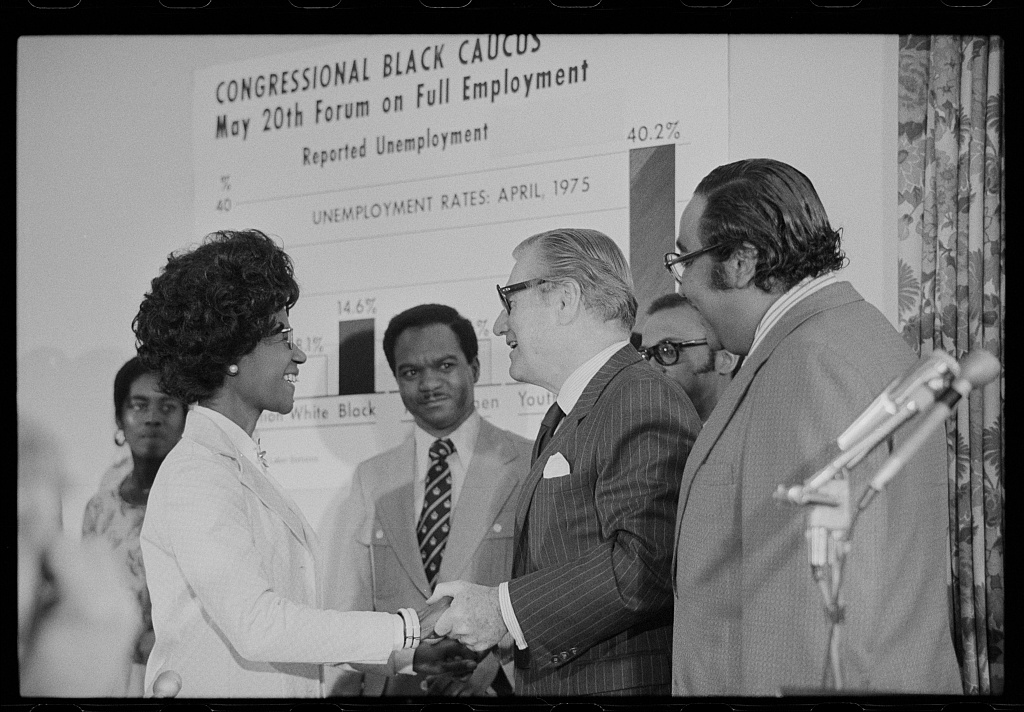
As we said earlier, there are legitimate roles for the government in the American economy, and addressing employment discrimination is (unfortunately) necessary.
Other reasons why some groups experience higher unemployment rates: sectoral distribution
While the employment data offers average rates of unemployment for different groups, for example, the averages hide some important variations. Have you heard the expression, ‘pink collar jobs?’ Pink collar jobs are traditionally jobs with a lot of women workers–personal service, nursing, teaching, social work, hospitality, etc. Other fields, like finance and construction, for example, are more male-dominated. Sometimes when our economy experiences an overall crisis–the 2008 Crash, the Covid years–it impacts certain sectors more than others, and this can mean a bigger impact on male or female unemployment accordingly. The 2008 Crash centered on the housing and finance industries, and that meant male employment was hit harder than women’s. During Covid, a lot of personal service jobs (nail salons, hotel and restaurants work, for example) where women predominate, were hit hard. Many sectors where men predominated could shift to remote work. Likewise, as many families needed to shift their lower wage earner to supervision of at-home children, women were hit harder than men. Looking at sectoral distribution of men and women’s employment can give insights into these impacts.
Some Useful Materials
A video on how to read/interpret the government’s jobs reports.
A video focussing on women’s job loses during Covid.
A video on the definition of unemployment.
A video discussing that definition of unemployment and who is left out.
A transcript of a podcast on teen employment/child labor.
Interesting findings on discrimination in employment.
Media Attributions
- WWII riveters © E.F. Joseph is licensed under a Public Domain license
- flowchart for Unemployment Definition © Bettina Berch is licensed under a CC BY-NC (Attribution NonCommercial) license
- labor Force Definitions © Bettina Berch is licensed under a CC BY-NC (Attribution NonCommercial) license
- Labor Force Participation Rate, U.S. © FRED is licensed under a Public Domain license
- Unemployment rate over time © FRED is licensed under a Public Domain license
- Unemployment, Teens © FRED is licensed under a Public Domain license
- Employment/total Population ratio, people with disabilities © FRED is licensed under a Public Domain license
- Binding price floor creating unemployment © Bettina Berch is licensed under a CC BY-NC (Attribution NonCommercial) license
- Unemployed, Single and Female! is licensed under a Public Domain license
- Congressional Black Caucus works on Full Employment © Thomas O'Halloran is licensed under a Public Domain license
