7 Roles of the Government in the Economy: Taxation and Reducing Inequality
Bettina Berch
Consider this
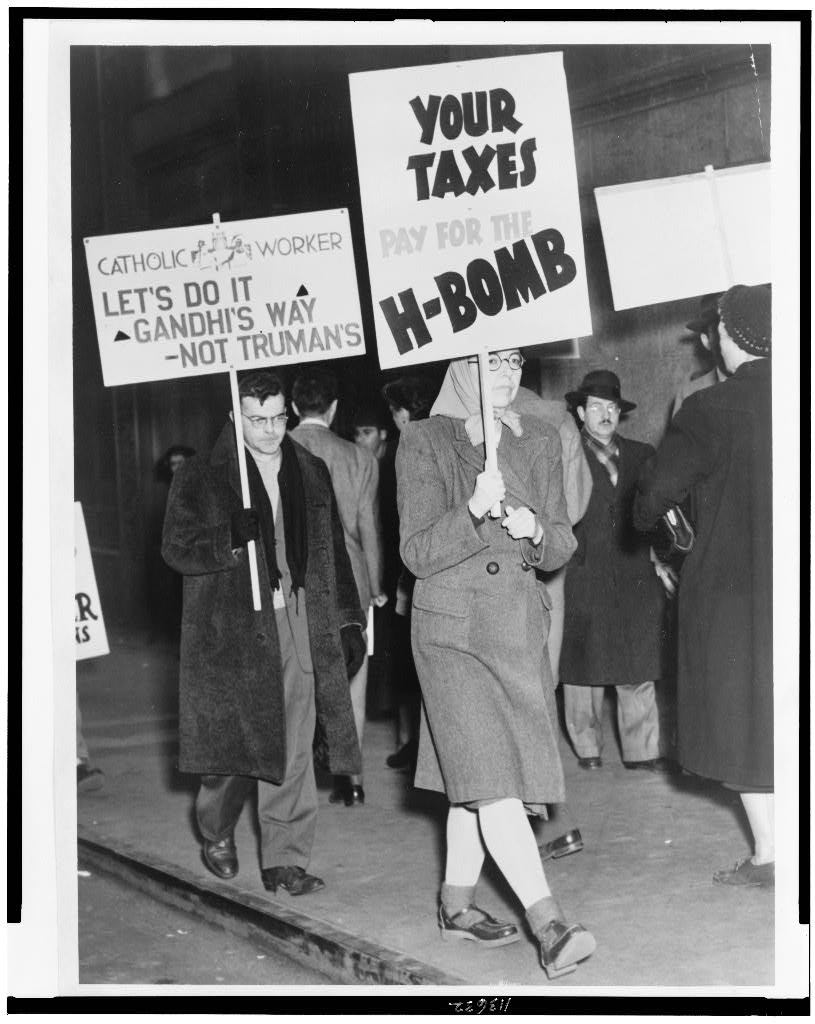
There’s a long tradition in the United States of going out and marching against injustice. These marchers in 1950 were protesting the development of the hydrogen bomb. Why do you think they took the approach of saying “YOUR TAXES pay for the H-BOMB”?
Have you ever noticed that if you just buy a dozen bagels, there’s no sales tax on it, but if they’re sliced or schmeared, they’re taxed?
Did you even know there was such a thing as an ‘edible gummy drinking glass’ —and also that it’s taxed in New York as a ‘confection,” not as an (untaxed) foodstuff?
I’ve just heard that people over 100 years old don’t pay state taxes in New Mexico—which is one you might want to discuss!
Taxation is so unpopular, you’d think they’d have gotten rid of it already. But taxation is a basic function of government. Governments collect taxes to finance their operations, and redistribute some of those tax revenues to address inequality. That makes it sound pretty simple, when it’s anything but. To begin with, the American government in its early years financed itself with revenues from excise taxes and tariffs it collected on goods coming into our country. (That elegant building at the tip of Manhattan, currently the National Museum of the American Indian, was formerly the Alexander Hamilton US Custom House, the workplace of government agents who inspected the cargo landing in New York and charged tariffs.)
After 1913, the federal government started receiving revenues from an annual income tax on citizens. We would call the income tax a tax based on your ability to pay. The other kind of taxes are user fees, based on your use of some good or service. If you go camping in a national park, you pay the government for that service. If you never camp, you don’t pay. Most people feel like the “user fee” tax is fair, since you’re only charged for what you use. And while that’s certainly true, and sometimes they go a step further and tell you the fees you paid will be used for the actual upkeep of that service—it’s not enough to cover anything else. Rarely would a user fee generate a surplus, much less enough extra money to do some income redistribution. For this, we need the income tax, with its marginal tax rates rising as incomes rise.
How Do We Evaluate Taxes?
Understanding that we have two basic types of taxes, we want to know how to evaluate them. We have several ways. First, you need to consider ‘tax incidence’—who’s supposed to be paying the tax. Is it supposed to be ‘progressive,’ so the higher your income, the higher the tax rate you pay? Is it supposed to be ‘proportional,’ with a constant tax rate for all income levels? Or is it ‘regressive,’ so when incomes are lower, the tax rate is higher? If you fill out your own income tax returns every April 15, you may notice that higher tax brackets pay higher tax rates on their incomes above a certain amount. People below a certain income bracket may actually receive money from the IRS if they can file an earned income tax credit. These are features of progressive tax schemes.
Sometimes a tax seems to be proportional–the same rate for everyone–but really isn’t. Consider the sales tax. You figure, everyone pays the same tax rate at the cash register, so it’s a proportional tax. But while everyone may pay the same 8.75% tax in New York City, spending on taxed purchases takes a bigger bite out of my (lower-income) budget than it takes out of Elon Musk’s billionaire budget. This unequal impact of a sales tax (or consumption tax, VAT, or any ‘flat tax’ ) is why they seem proportional but are actually regressive. Few taxes are explicitly regressive—the incidence issue only comes up when you look deeper at who is consuming the thing you are taxing. Almost three times as many low income people smoke cigarettes as high income people—so the cigarette tax might look proportional, but its impact is regressive.
Finally the effectiveness of various tax schemes needs to be evaluated. Are the people who are supposed to pay this tax actually paying it, in full? Or are there a million ways to avoid paying? Do you live in Vermont but drive over to New Hampshire to buy your cigarettes, where there’s no state tax?
Finally, economists ask us to think about the distortions this tax might create in the marketplace. When we tell New Yorkers we’re going to start an extra tax on all sodas with sugar—it makes headlines in the papers. People run for office promising to defeat this tax. Clearly the sugary-beverage lobby was determined to make this an issue, whether any of us cared or not. The formal way of determining if people will change their buying behavior when there’s a price increase (which is what a tax becomes) is our old friend ‘elasticity.’ If buyers and/or sellers of some good are very price inelastic, when you impose a tax on that good, they don’t change their behavior much at all, which means fewer market distortions. This is why economists often suggest taxing necessities (lots of price inelastic demand there ) even though it seems unfair.
How unequal is the income distribution in the United States?
One way to answer this question is to line up all Americans according to their incomes, from high to low, divide them into five equal-sized groups (quintiles), and then compare the average income each fifth receives:

Even including various transfer payments (welfare benefits, unemployment checks, etc) and the extras like the earned income credit that low-income people receive from the tax system, the U.S. remains very unequal. As the bar chart also shows, each quintile received more income in 2020 compared to 2019. It’s also true that the lowest income group had a greater percentage increase–but starting from a low baseline.
When the Pew Research Center compared income inequality in 31 OECD countries, the U.S. had the second highest inequality of all–with Chile coming in first (and that’s after including transfer payments and taxes).
Income isn’t everything–there’s the wealth distribution to consider
To see the whole picture, we need to go beyond the income distribution, and examine wealth distribution. Think of wealth as all the assets you’ve got that didn’t come from your paycheck—maybe it’s something your grandparents left you when they died, maybe it’s a bank account, or a box of cash in the closet. Generational wealth, assets passed down from the ancestors, builds more wealth…and more inequality. If we look at some current data for average wealth in the U.S., broken down by race, the graph makes the situation clear:

What can be done about such dramatic wealth inequality? There are financial coaches and on-line communities that urge people of color, in particular, to make financial decisions after asking the big question: “will it build generational wealth?” So buying a big house and scrimping on daily spending to afford it—that’s building wealth that can be handed down to the next generation. Don’t spend on frivolous stuff, but buy solid assets!
There are others who look at the present-day racial wealth gap as an argument for financial reparations for slavery. Were it not for a history of enslavement, people of color today would have accumulated more wealth, throughout the generations. Society has offered other parties reparations for wrongs they’ve suffered—Holocaust payments to concentration camp survivors, payments to Native American tribes from the U.S. government, etc. While the amounts are rarely considered suitable, they may be better than nothing, since they represent an acknowledgement of guilt and responsibility, something African-Americans in America have never received.
How we graph a tax
We can use some of the tools we have learned to see what happens when a tax is placed on some good in a marketplace. The first basic insight, is that it doesn’t matter if it’s the shopper paying the tax at the cash register (demand side) or the manufacturer paying the tax on all units leaving the factory (supply side)—either way, the burden of the tax is going to be shared by both sides. And either way, there’s going to be less economic activity taking place, a reduction in quantity sold.
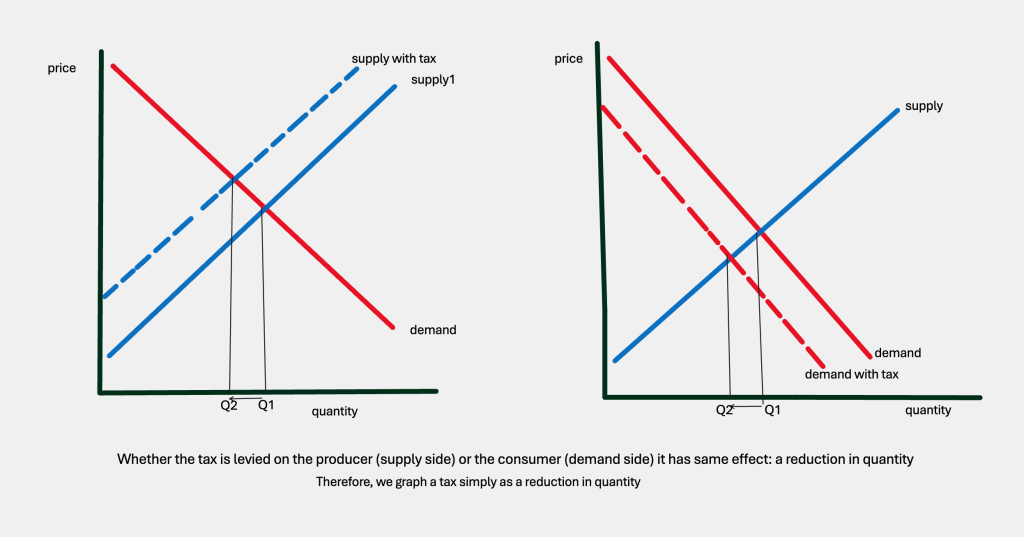
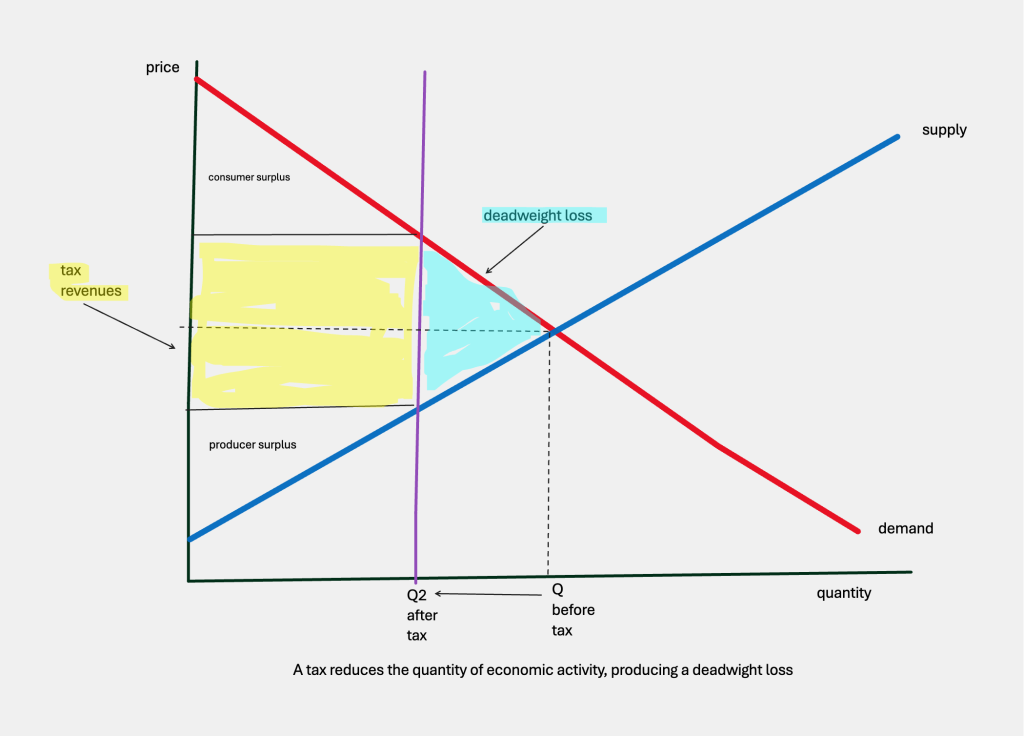
In the example above, you can draw the impact of the tax on the supply side or the demand side. Either way, you have a smaller amount sold. For simplicity, we can skip actually shifting either curve and just draw a new vertical line at the lower quantity:
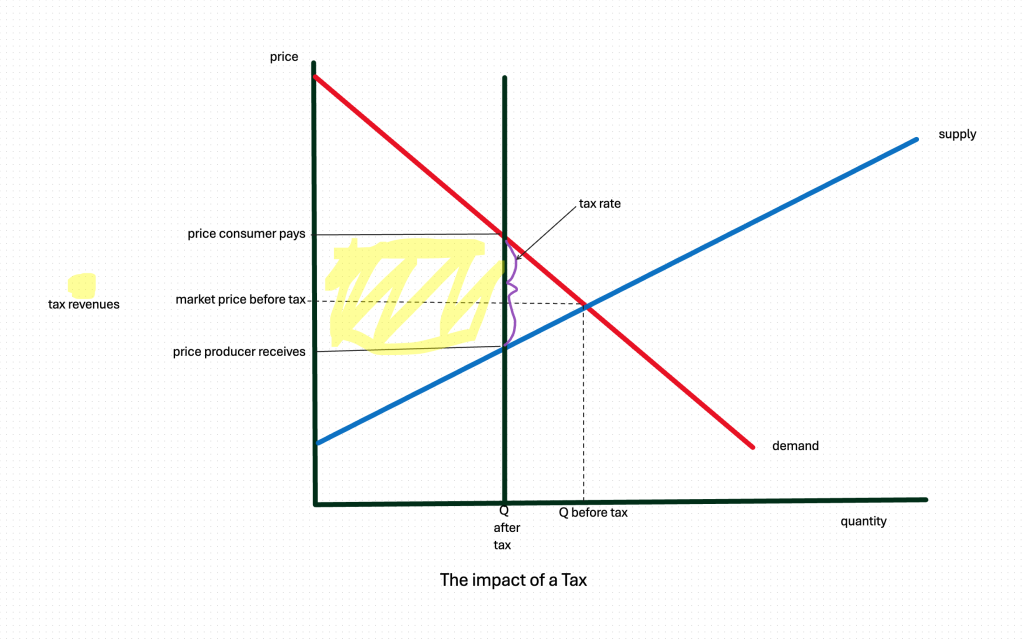
We then label the higher price the consumer pays, the lower price the seller receives, and we can highlight (in yellow) the rectangle of tax revenues going to the government (size of tax x number of units being taxed). Before we figure out the welfare implications of a tax, let’s stop and look for a moment at what difference supply or demand elasticity makes, in a taxation situation.
Let’s just look at the different impact a tax has, in a market with an elastic and inelastic curves:
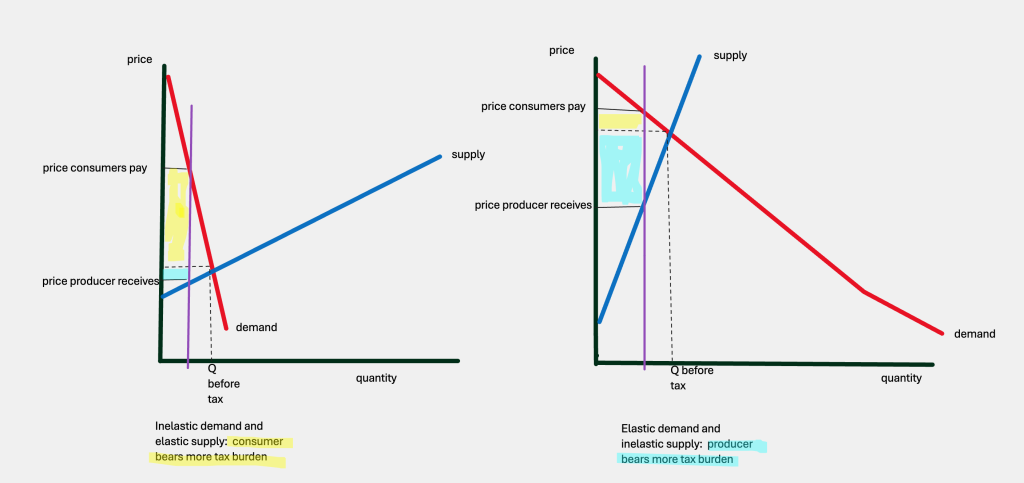
When demand is price inelastic (that steep demand curve), the buyer bears most of the burden of the tax. The price the consumer pays goes much higher, while the suppliers receive slightly less. In the second graph, the suppliers are price inelastic and the demand side is more elastic, and so the supply side bears more of the tax burden. This should make sense to you. If demand is not very sensitive to price increases, and a big tax is imposed (which becomes a price increase), inelastic demand means shoppers keep buying it, even with the tax.
If we look at taxation with a welfare analysis, we see immediately that reducing the size of the market means we are cutting off some social surplus—in the graph below, it’s the blue area labelled “deadweight loss.” This triangle represents economic activity that would have taken place before the tax arrived, but now isn’t happening. That’s an outright loss, transactions that won’t happen. We also see that both consumer surplus and producer surplus have decreased, and we have a new type of surplus highlighted in yellow—tax revenues. We still think of tax revenues as a benefit to society, part of Total Surplus, since tax revenues come back to benefit us in the form of new schools and roads.
Can You Cut Tax rates and Still Get More Revenues Coming In? The Supply Siders!
Welfare analysis is going to help us untangle a very thorny tax question: is it possible to “cut taxes” (meaning, reduce tax rates) and still get more tax revenues? This is the basic idea of ‘supply-side economics,’ and in particular, the Laffer curve, named for Professor Arthur Laffer, an advisor to President Reagan. The logic behind this curve rests on the idea that when tax rates increase, deadweight losses grow, because you are taxing smaller and smaller numbers of economic activities.
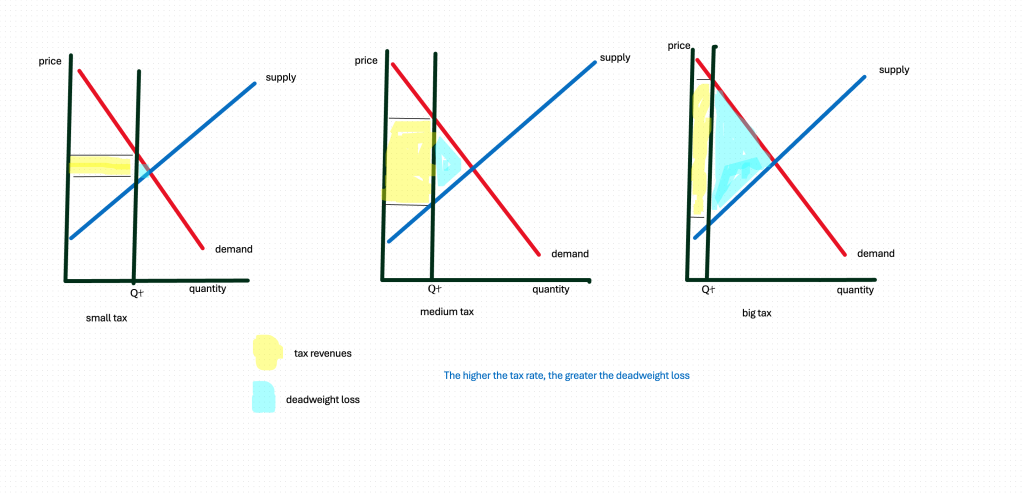
Look at the three graphs above, where we start with a small size tax, then a medium tax, then a very high tax. The yellow rectangle representing tax revenues might get larger when we go from a tiny tax to a medium size tax, but it goes down to a small area when the tax rate is very high. A high tax rate on a small number of transactions is not going to result in much tax revenue.
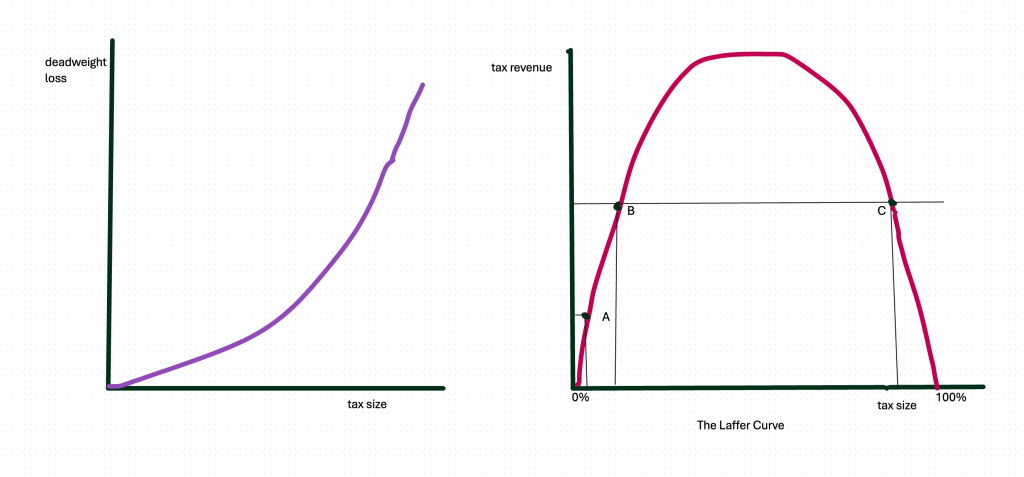
Above, we are plotting deadweight loss against tax size, seeing the geometric growth of deadweight loss. Finally, on the right, we have the Laffer curve, plotting tax revenues against tax rates or tax size. Laffer’s basic proposition was–let’s cut tax rates from C to B and look, you’ll get just as much revenue! This was welcome news to many in the tax-cutting world, especially Governor Brownback of Kansas, who decided in 2012 to cut tax rates in half and to remove some taxes altogether. Kansas barely survived.
Why, you might ask? Let’s look closer at this Laffer curve:
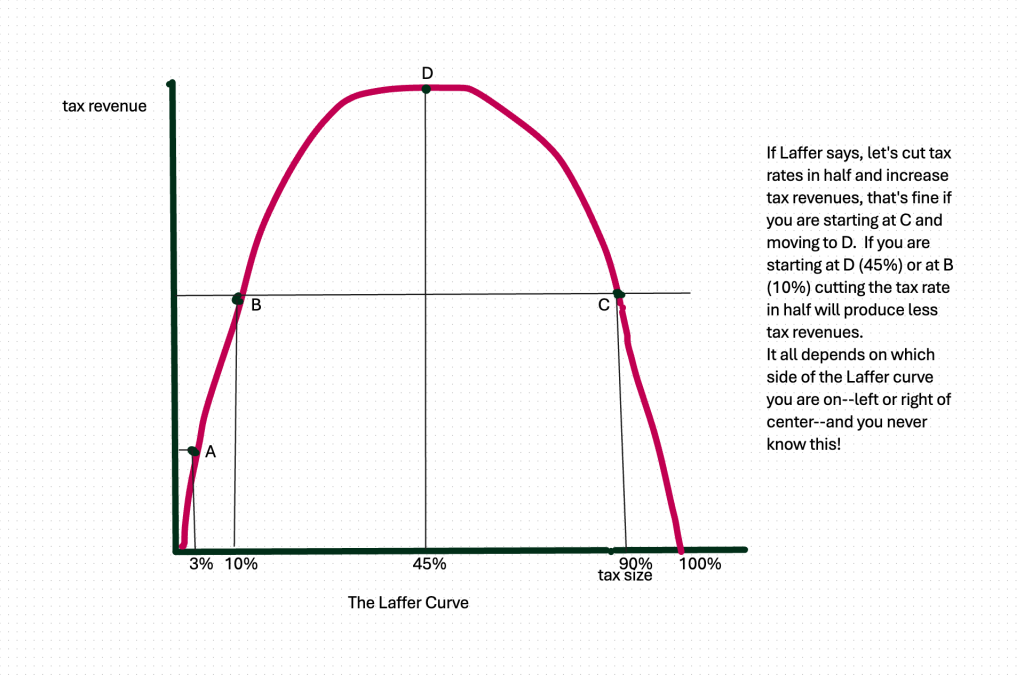
If you started at point C, cutting tax rates to D would be fabulous—your lower tax rates would be bringing you more tax revenues. But suppose you are at D and you cut tax rates down to B—then you will see a big drop in tax revenues. It all depends where your starting point is, on this curve. Do you have any way of knowing? No, not really, because this is a hypothetical relationship, not one derived from actual data. Of course, after the Kansas disaster, we could definitely say that the actual numbers on Brownback’s tax cuts turned out to be a bad idea. But it hasn’t stopped people from continuing to claim that tax cuts ‘pay for themselves’ or other versions of the Laffer story.
In this brief look at taxation, we have seen how a couple basic tools–elasticity and welfare analysis–can give us useful perspectives on who’s bearing the burden of a tax, and the relationship between tax rates and tax revenues. We have seen that the United States has a very unequal distribution of both income and wealth; redistribution through our tax system has a long way to go. Keeping in mind the tools of economic analysis we’ve been learning, it’s time to start building our macroeconomic model.
Some Useful Materials
A video on tax incidence—who’s paying most of the taxes in America?
What would the optimal tax rate be, to keep people working but still generate enough to redistribute?
Read Robert Reich on myths about taxing the rich!
Compare inequality around the world.
Another remedy for inequality could be baby bonds.
Media Attributions
- Your Taxes Pay for Bombs © Fred Palumbo is licensed under a Public Domain license
- The Distribution of Income in the U.S., 2019 to 2020 © Congressional Budget Office is licensed under a Public Domain license
- Average wealth by race/ethnicity, 2023 © St Louis Federal Reserve is licensed under a Public Domain license
- salestax#1 © Bettina Berch is licensed under a CC BY-NC (Attribution NonCommercial) license
- sales-tax2rev © Bettina Berch is licensed under a CC BY-NC (Attribution NonCommercial) license
- elasticity and tax#3 © Bettina Berch is licensed under a CC BY-NC (Attribution NonCommercial) license
- tax impact–welfare analysis © Bettina Berch is licensed under a CC BY-NC (Attribution NonCommercial) license
- Laffer curves #1 © Bettina Berch is licensed under a CC BY-NC (Attribution NonCommercial) license
- Laffer #2 © Bettina Berch is licensed under a CC BY-NC (Attribution NonCommercial) license
- Laffer #3 © Bettina Berch is licensed under a CC BY-NC (Attribution NonCommercial) license
