3 How Markets Work: Supply and Demand and Equilibrium
Bettina Berch
Consider this

In our modern economy, it can be very hard to find examples of supply and demand in a perfectly competitive market, so maybe this example of a fishmonger in a food hall works? But then you think, don’t I always go to my favorite seller when I go to the greenmarket? That’s not really perfect competition then. Can you find examples of perfect competition in your own day-to-day life?
The crown jewel of model-making in economics might be the supply and demand model! Draw a few little lines that cross in the middle of a half box—and that’s a powerful tool for understanding the price system! Since this model is fundamental to many areas of modern economics, we’ll walk it through slowly.
Perfect Competition
Let’s imagine we’re going to analyze the marketplace for some simple, ordinary item. This item has no brand name attached, nothing that makes it any different from the other ones for sale—it’s completely generic. Let’s say our item is a single rose stem, the kind they sell at your corner market or even in a grocery store, depending where you live. Furthermore, there are many sellers of these stems and there are many buyers. No one buyer or seller can influence the market price. If one seller tries to raise the price by a dollar, people will walk to the next shop. If one buyer tries to argue the price down, the seller will refuse.
This kind of market situation is what economists call ‘perfect competition.’ The item being sold can be very nice or very basic but it is completely generic. It’s the same item everywhere. Buyers and sellers are what we call ‘price takers.’ We go to the market or store and we accept what the price is, we don’t try to argue about it. We ‘take’ this price as a given. If we like the price, we buy. If we don’t like the price, we walk away. Our only decision is how many units of this item we wish to buy. If we’re selling this product, we are also ‘price takers.’ We see the price in the marketplace, and we accept it as given. We do not try to scheme about how we could push that price up. We see the price, and decide how many units we want to supply, at that price.
Of course, this is not the usual situation in the real world. It’s the opposite! We are surrounded by items that may have been generic at one time, but now they’ve been made special. Tennis shoes used to be ordinary—they were white canvas with rubber soles, with no visible brand name. You could buy them anywhere and they were more or less the same. Today, ‘athletic shoes’ are so particular, so collectible, so expensive, that people buy them and never take them out of their boxes. Salt used to be iodized or not, that’s it, and you didn’t notice the brand. Now there’s a world of salts, each with a special origin and use. Even eggs are branded now. All this branding activity is a result of sellers trying to move their products out of the world of perfect competition, into the world of ‘imperfect competition,’ in order to raise prices. If you take more economics classes, you will be examining how imperfect competition works. But first things first—perfect competition. If buying roses seems too strange to you, imagine buying a quart of 2% milk, an ordinary black umbrella on a rainy day, or a cup of coffee from the stall on the corner by your school. These can all be items that we buy without paying attention to a brand name, items we might buy from a wide range of sellers. Likewise, sellers can imagine selling these generic items to a huge, anonymous marketplace of buyers. Every seller would be aware that they were just one among many sellers, with no special tricks that would bring them more buyers.
Demand
We’ll start by analyzing demand under perfect competition, because we are all familiar with demanding, or buying things. Let’s say you are on your way to dinner at a friend’s house and you decide to bring her a rose. You may see several stores on your way selling very similar roses for very similar prices. If you saw a shop offering roses for free, you might grab 5, one for everyone invited! If they cost $1 each, you might decide this was still very cheap, and buy 4. If they cost $2, you might buy 3. If they were $3 each, you might only buy 2. (If they cost more, you might not buy any roses, but look around for some ice cream to bring instead.) When things cost more, we buy less; when things cost less, we buy more. In other words, there’s an inverse relationship, a negative relationship, between price and quantity. This might seem like second nature to you, but economists call it the Law of Demand.
Let’s put our information in a table:
| Price | Quantity Demanded |
| $0 | 5 |
| $1 | 4 |
| $2 | 3 |
| $3 | 2 |
With this data, we can construct a very simple demand curve for a rose stem as a function of price. In economics, we do this in a particular way: we always put price-type variables on the vertical axis and quantity-type variables on the horizontal axis. This is arbitrary—there’s no particular logic involved. But since we all agree to do this, it makes it easier to read other people’s graphs. So call it a rule, and let’s graph this information:
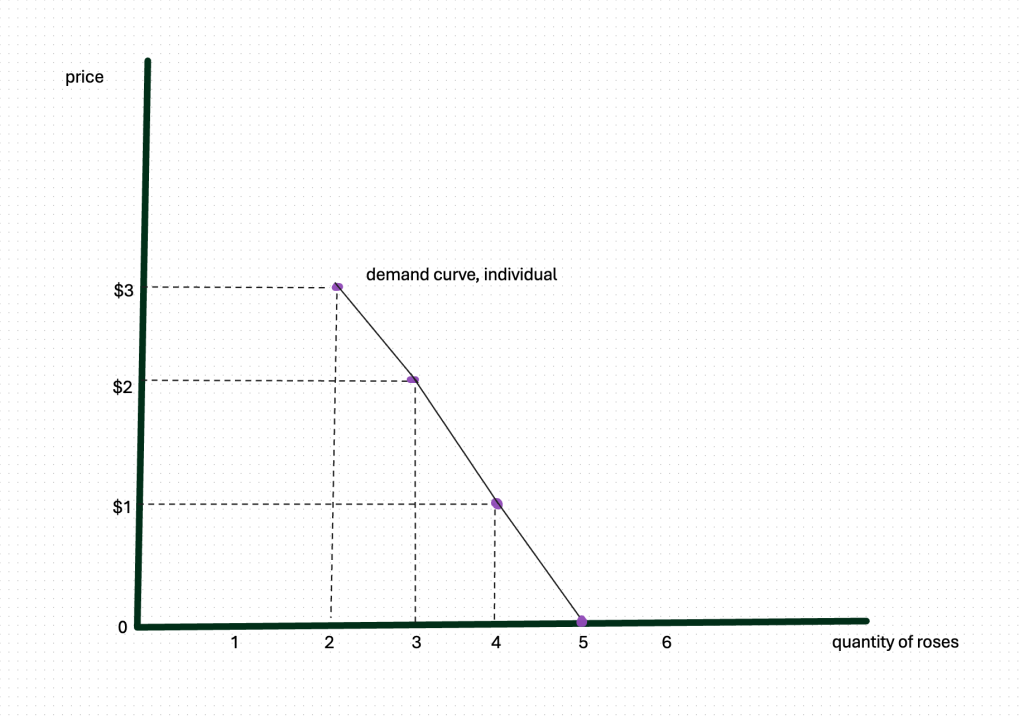
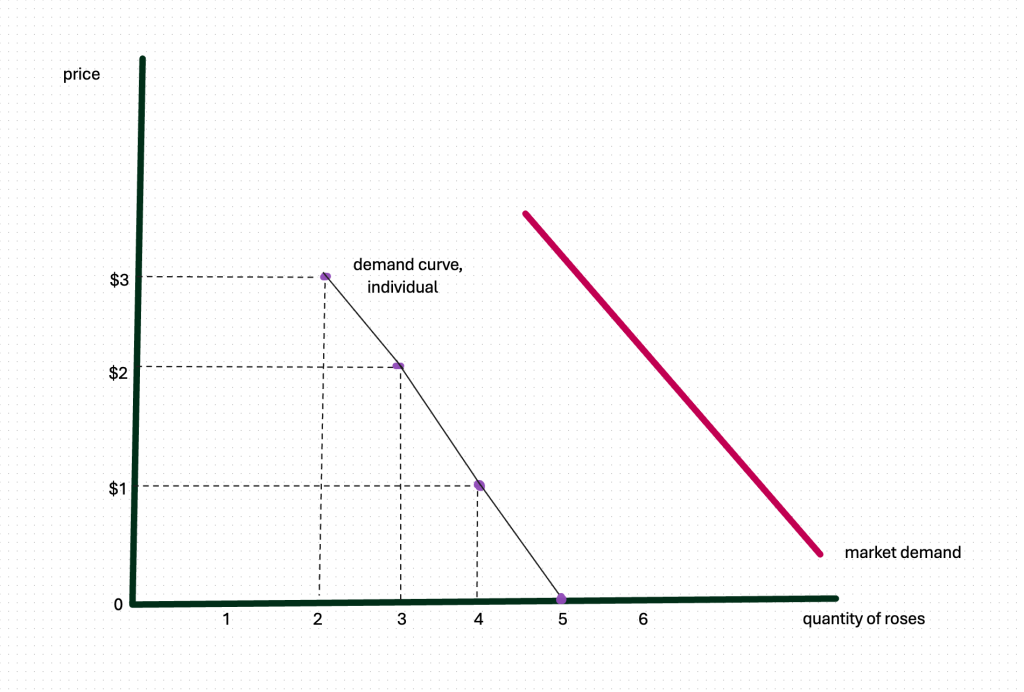
What could we notice about this demand curve? First, it’s not what most people would call a curve. But economists call it a curve, so we will too. Also, it’s not a perfectly straight line—or even what we might call a curved line. Demand curves take whatever shape the data gives them—straight, smooth, rounded. But if they follow the Law of Demand, and if you have put price on the vertical axis and quantity on the horizontal axis as you are supposed to do, they will be what we call downward-sloping, so that when price is lower, the quantity demanded increases. This demand curve is one person’s demand curve. Since we’re in perfect competition, we know we have to have a lot of buyers. To get a market demand curve, we add up all the individual demand to get a market demand curve, which sits to the right of any individual’s curve.
Supply
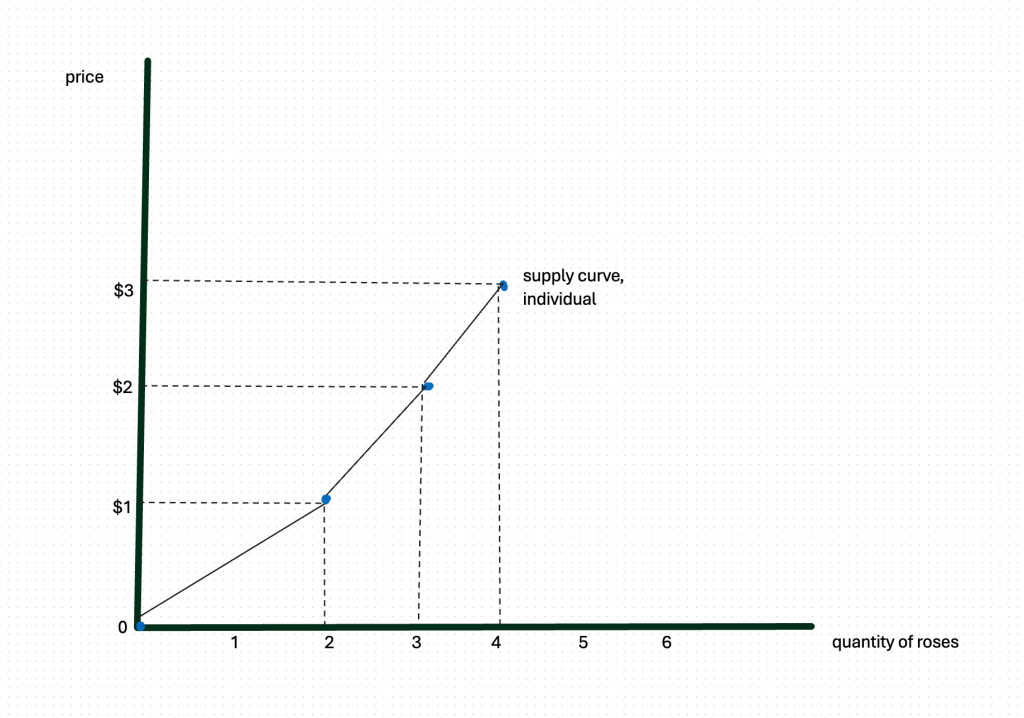
Now, let’s look at the rose market from the point of view of a rose-seller, a rose-supplier. Imagine you run a corner fruit-stand and you see other shops nearby selling roses. Why not give it a try? You make a phone call to your wholesaler to find out what they’d charge you for roses, you make a few calculations, and you look around at what neighboring shops were charging for roses. If someone was giving them away (charging zero) you’d decide selling roses was a bad idea and offer none. If the neighboring shops were selling stems for $1, you might order 2. If the neighborhood price were $2, you’d order 3 to sell. If the neighborhood price were $3, you’d try to sell 4. The higher the market price, the more stems you’d want to be selling, since you’d be making more money on each sale.
Again, let’s make a table:
| Price | Quantity Supplied |
| $0 | 0 |
| $1 | 2 |
| $2 | 3 |
| $3 | 4 |
From this individual seller’s supply data, we could draw a curve:
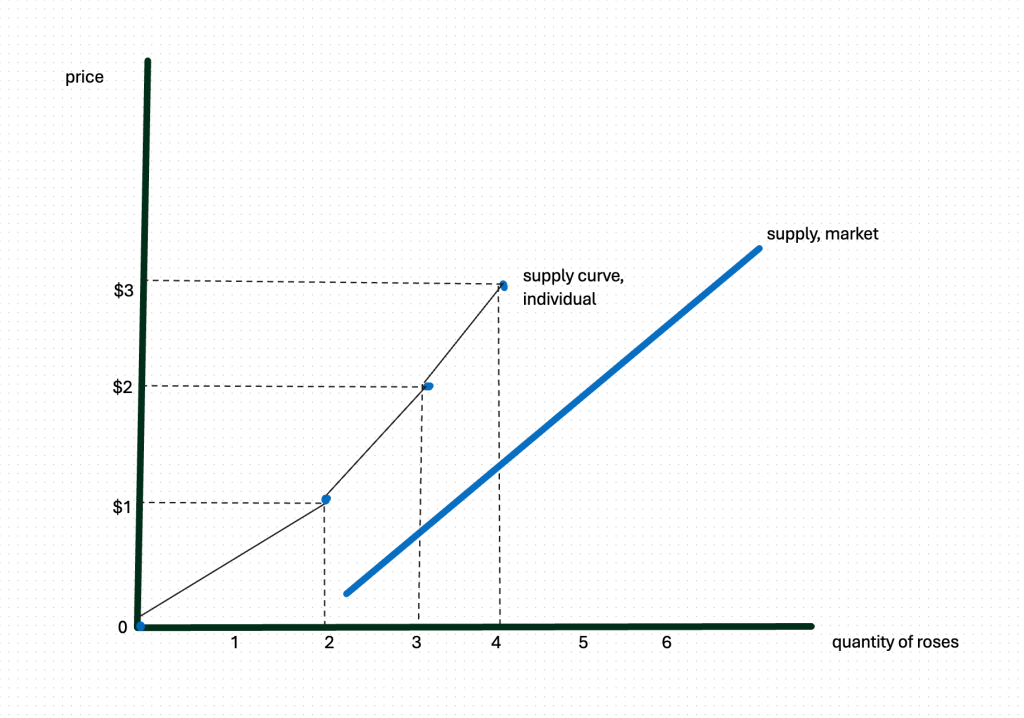
Again, in perfect competition, we’d have a lot of sellers, giving us a market supply curve to the right of the single seller:
Now let’s put together our market demand and our market supply curves:
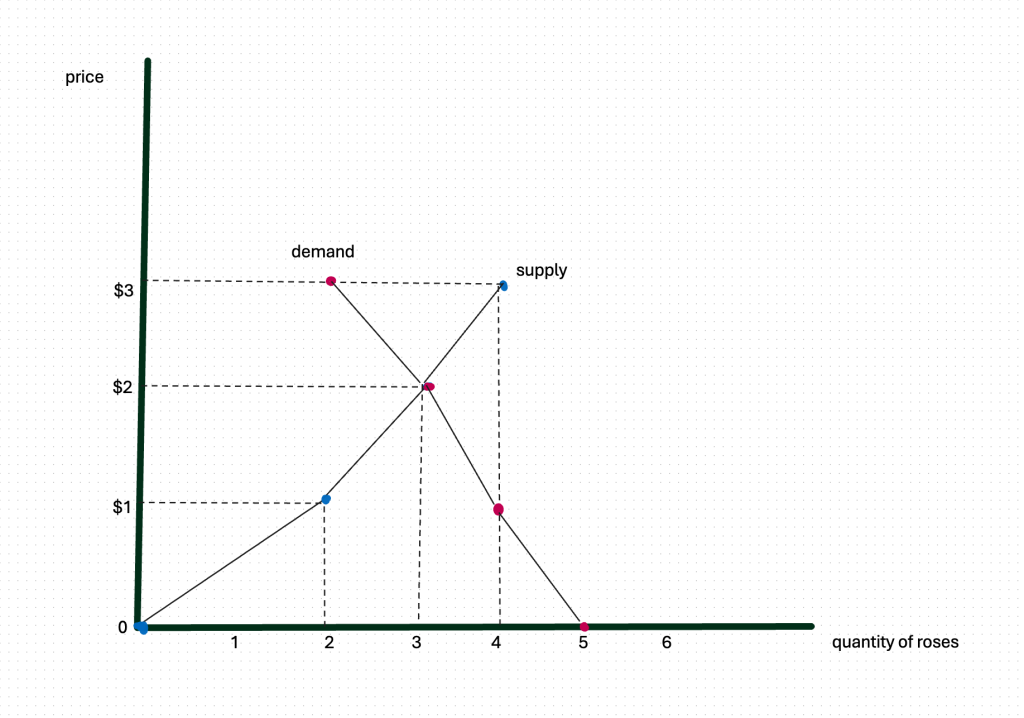
Looking at our graph, we see that if the price in this area had been set at $3 a stem, supply would be much greater than demand. There would be roses unsold. What would sellers do, seeing unsold roses as the night went on? They’d cut the price! When they cut the price down to $2, supply would exactly equal demand.
On the other hand, if they priced their roses at $1, they’d see a line forming outside the flower stall. They might realize that they had priced their roses too cheaply, and raise the price. When they raised the price to $2, supply would exactly equal demand.
In this situation, we would call $2 the equilibrium price. At $2, the amount supplied equals the amount demanded. Market equilibrium is a lot like how equilibrium is defined in physics—the forces acting on it are exactly balanced, so it stays where it is. We would call $2 the market clearing price, since the market is cleared of shortages or surpluses. Changes in price move buyers or sellers to act, and it is this signaling function of prices that the famous economist, Adam Smith, called the Invisible Hand of markets. In perfect competition, no one tells anyone they must buy or sell more or less; everyone sees the price and acts in such a way, that markets clear themselves.
Shifting curves
We laid out our data for market supply and demand under the assumption of ceteris paribus, that all other things going on in the world should be held constant. Realistically, we know that many things are changing in the world, and many of them could be relevant to the market for roses. Certain holidays, like Valentine’s Day or Mother’s Day, increase peoples’ demands for roses. Hot weather months decrease the supply of roses. A newspaper story on roses causing allergies could impact this rose market. It is time to see how to incorporate relevant changes in the world into our market model.
Let’s say it’s the day before Valentine’s Day, a time when a lot of people who don’t normally buy flowers, go out to buy flowers for people. How do we show this?
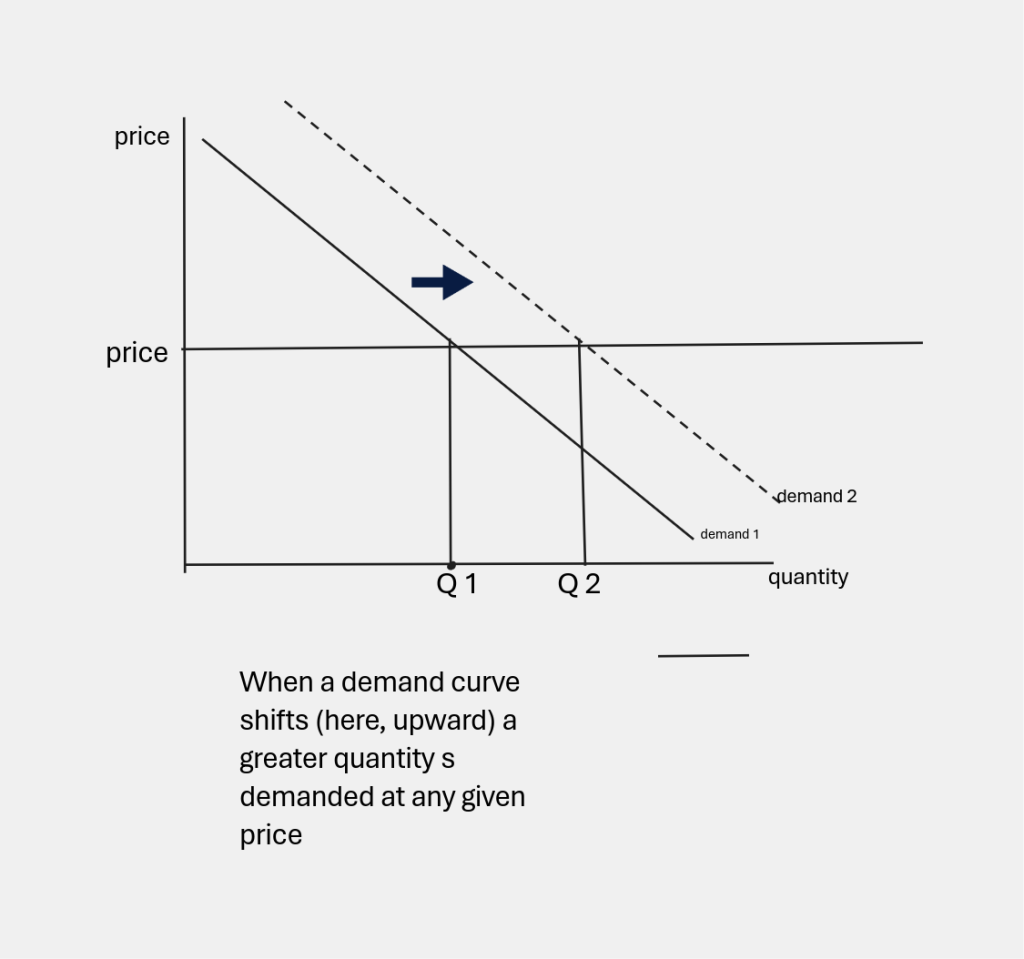
First, let’s consider the impact of Valentine’s Day on demand. At any given price, there might be twice as many people as usual trying to buy roses.
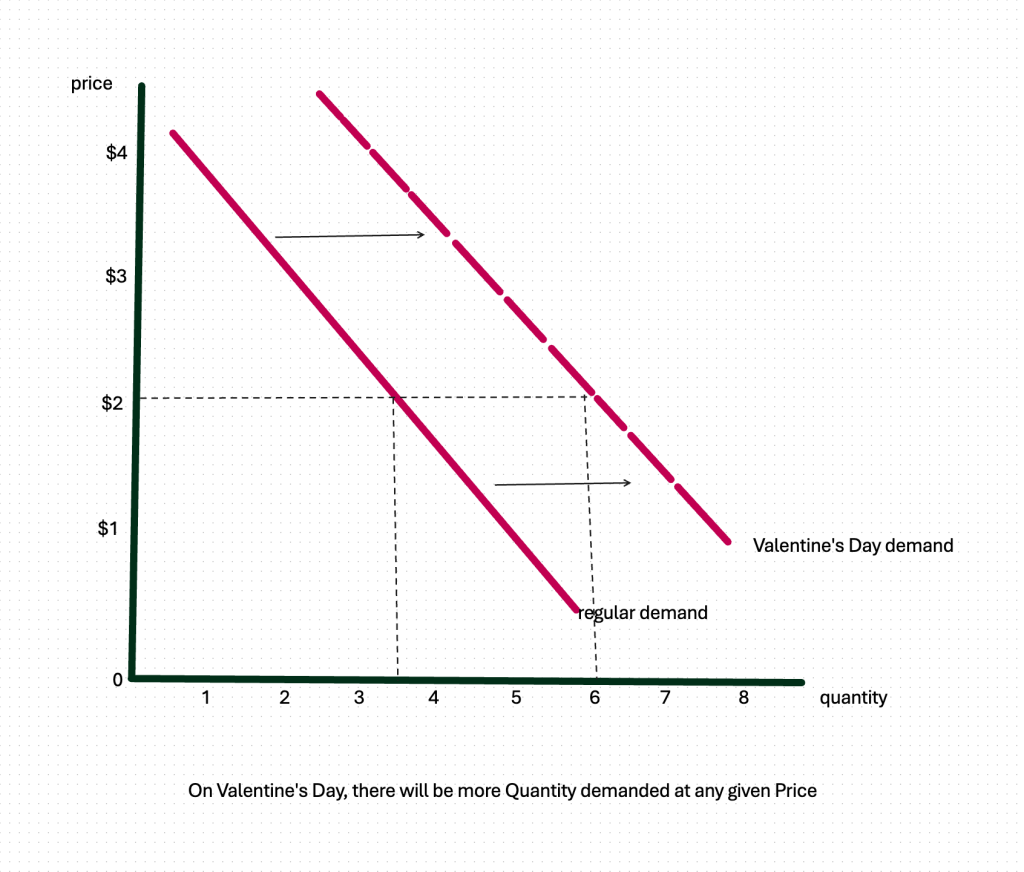
Our new market demand curve for Valentine’s Day has shifted to the right (or we could also say, moved upward). At any price, more roses are demanded. If nothing else changed, this shift in demand would result in a higher market price.
It is also possible that market supply will shift in response to the holiday. Flower suppliers may time their harvesting so they can supply more roses at any given price, as the holiday approaches. Let’s graph it:
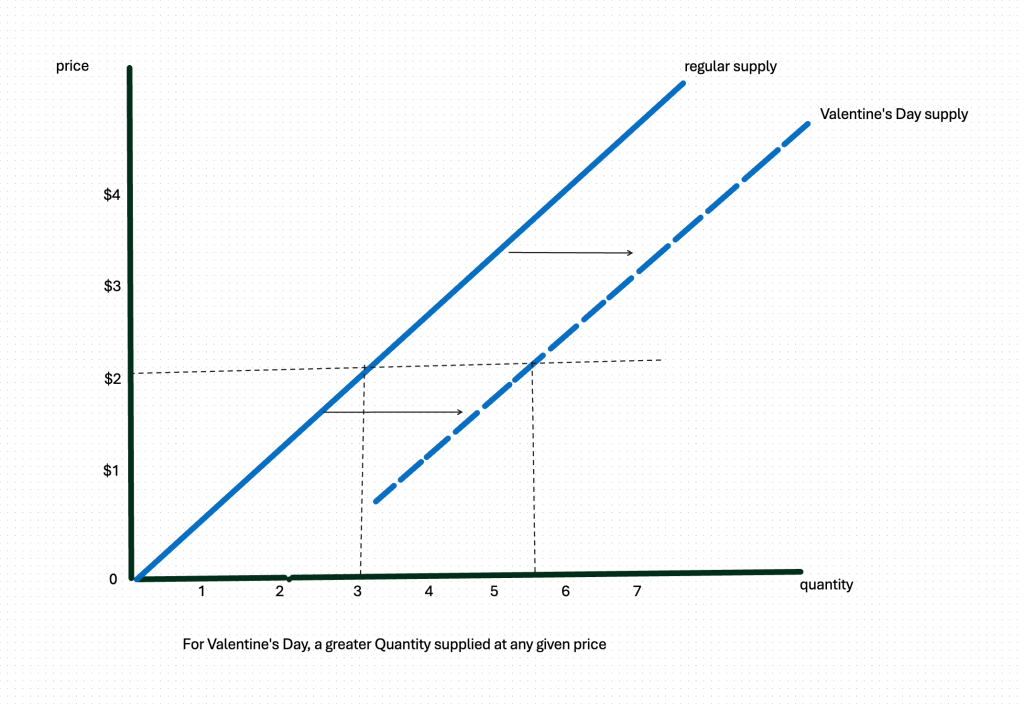
As we can see, the new supply curve has shifted to the right (or moved downward). More units of roses are being supplied to the market at any given price.
Now let’s put our demand and supply situations into one graph:
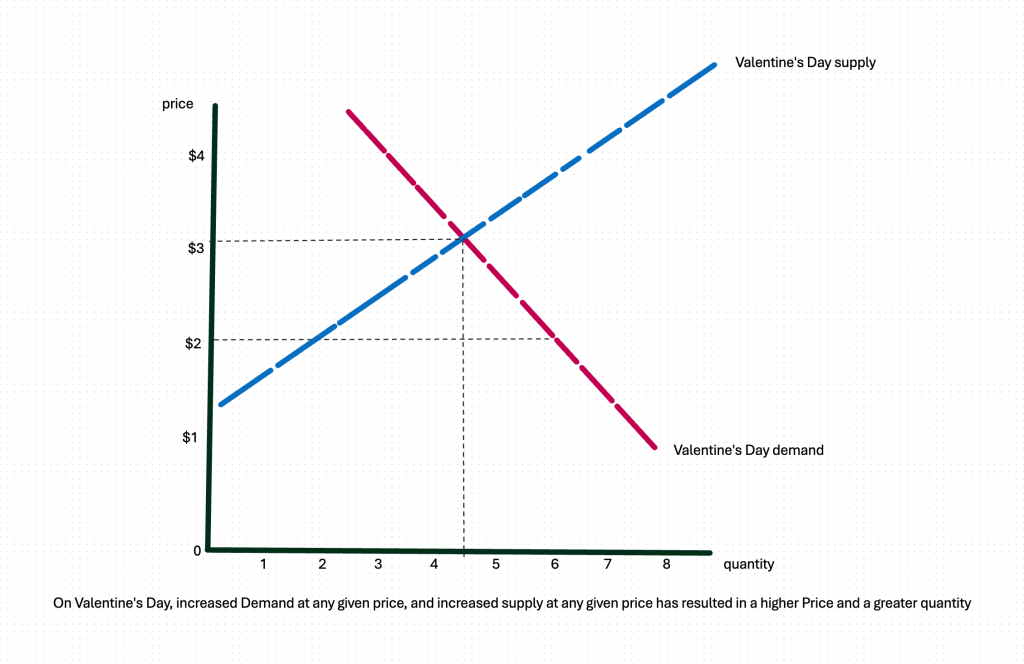
The new market equilibrium price for roses during the Valentine’s Day holiday is higher than it was on a non-holiday—due to increased demand. But because suppliers have also anticipated the holiday and supplied more roses at any given price (our shifted supply curve), the price increase is not as high in the end, as it would have been if suppliers had not responded.
Many things can shift demand and supply curves. But not every change in the world will shift a curve. In particular, a change in the price of roses will NOT shift a demand or supply curve—and this is something students sometimes find confusing. You may think to yourself, if the price of roses goes up, I’m going to demand fewer roses…so wouldn’t that shift the curve? NO! If the price is higher, we will move along our same old demand curve to see how many units we will demand at that price.
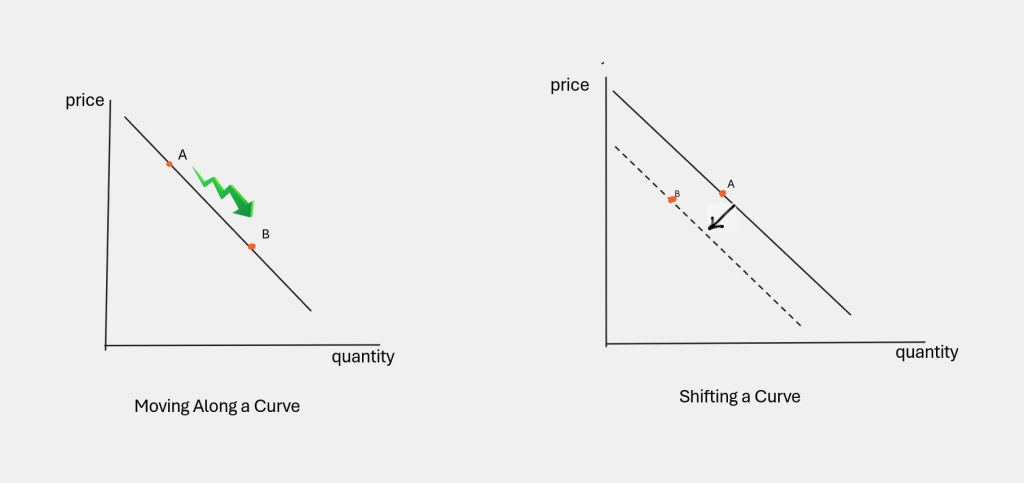
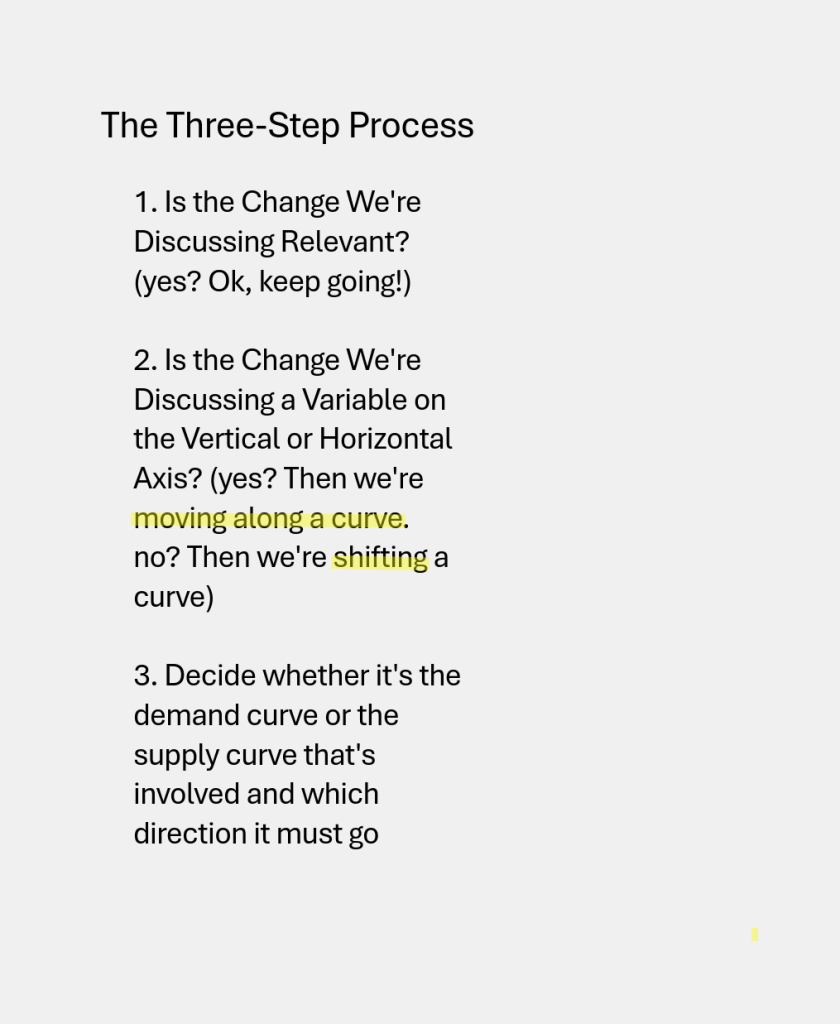
To keep from being confused, whenever a change is proposed, ask yourself three things (the ‘three-step process’):
1. Is this proposed change (a holiday, new tastes, etc.) relevant to this market?
2. If it is relevant, is this change represented on either axis of the graph? If the proposed change is not the actual variable on either axis, we will have a shift of one or both curves.
3. Now, which curve is shifting? Listen carefully to the language describing the change. Does it involve “demand talk”—’I’m shopping,’ ‘I want to buy’. Or does it involve “supply talk”—‘it’s gotten more expensive to produce this thing,’ ‘we had technological change in producing this.’
In the first example in the graph below, I’ve gone to the market to buy tea, which is usually $2 a box. Today it’s $3 a box. How do I graph this?
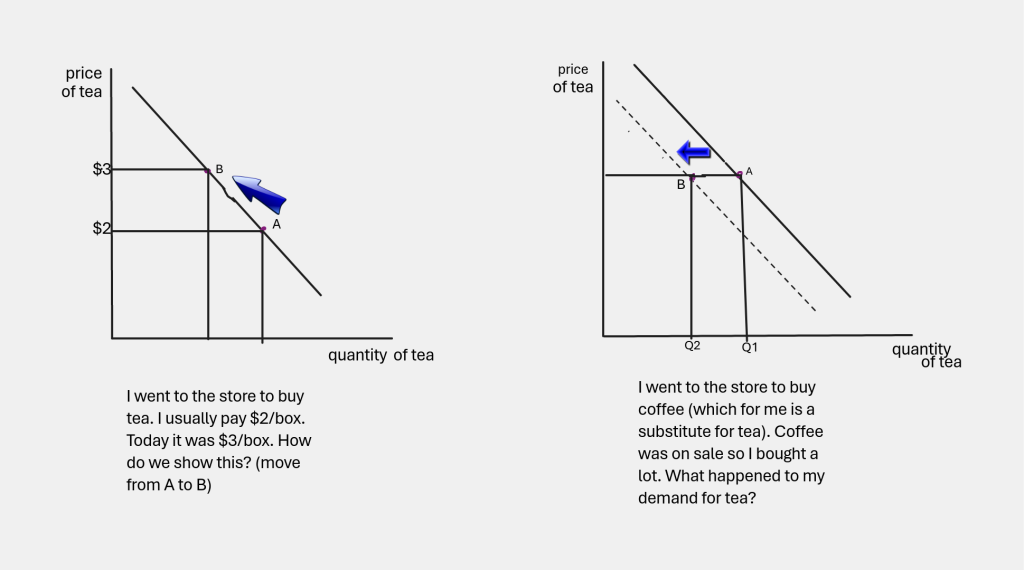
The first question—‘is tea being more expensive than usual today’ is that relevant? Yes. Is ‘tea going up in price’ a variable on either axis? Yes it is, it’s the variable on the vertical axis. So I will move along the demand curve I’ve already got, from point A to point B.
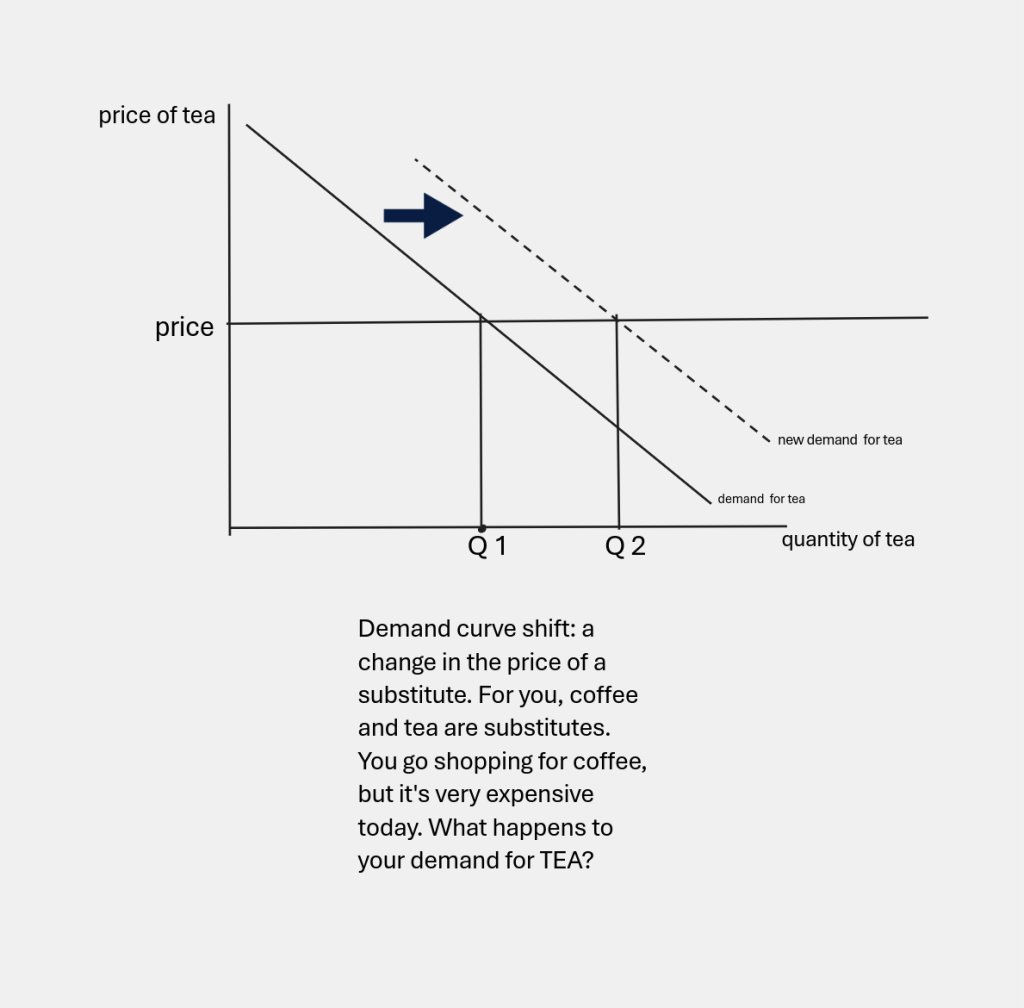
Consider the second graph above. It’s showing me my demand curve for tea, but now there’s a new situation. I’m going to the store to buy COFFEE, which I consider a substitute with tea. (That language just established relevance!) At the store I see that coffee is on sale, so I put a lot of coffee in my cart. What happens to my demand for tea, which was also on my shopping list?
Again, the 3-step process. Is coffee-on-sale relevant to my demand for tea? Yes. Is lower-price-for-coffee a variable on either axis? No! So I will shift my demand curve for tea downwards or to the left, because I will want less tea at any given price.
Shifting supply curves
Now let’s consider some typical things that shift curves. Let’s start with supply curves. Look first at what difference it makes, in general, shifting our supply curve upward, or to the left:
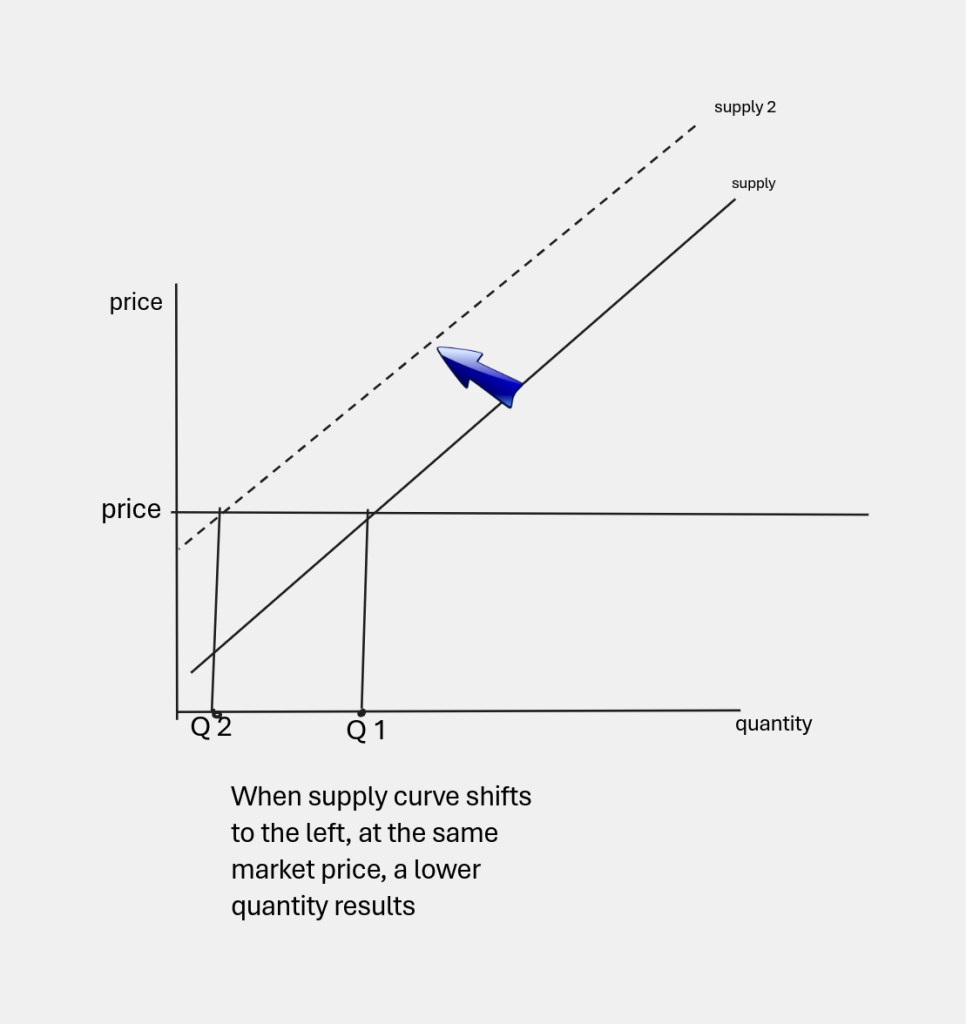
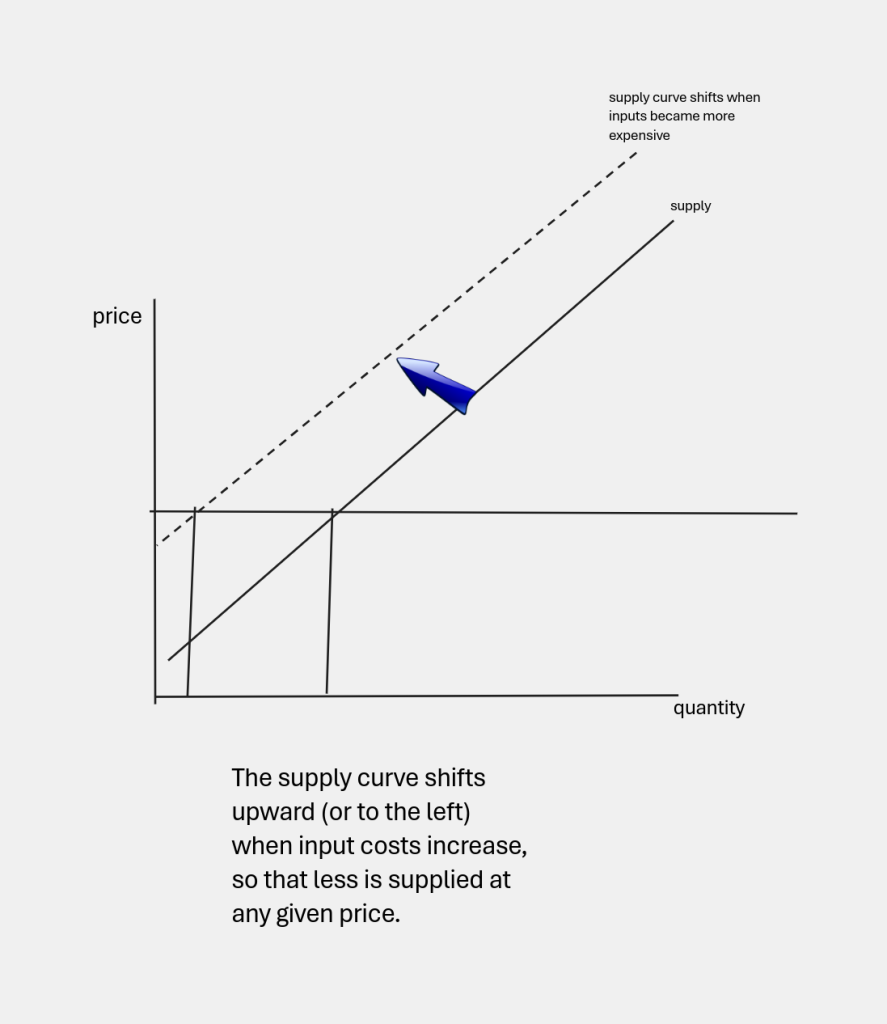
It shows us that when input costs go up, for example, I will supply less of that good. Let’s look at some specific things that shift supply curves.
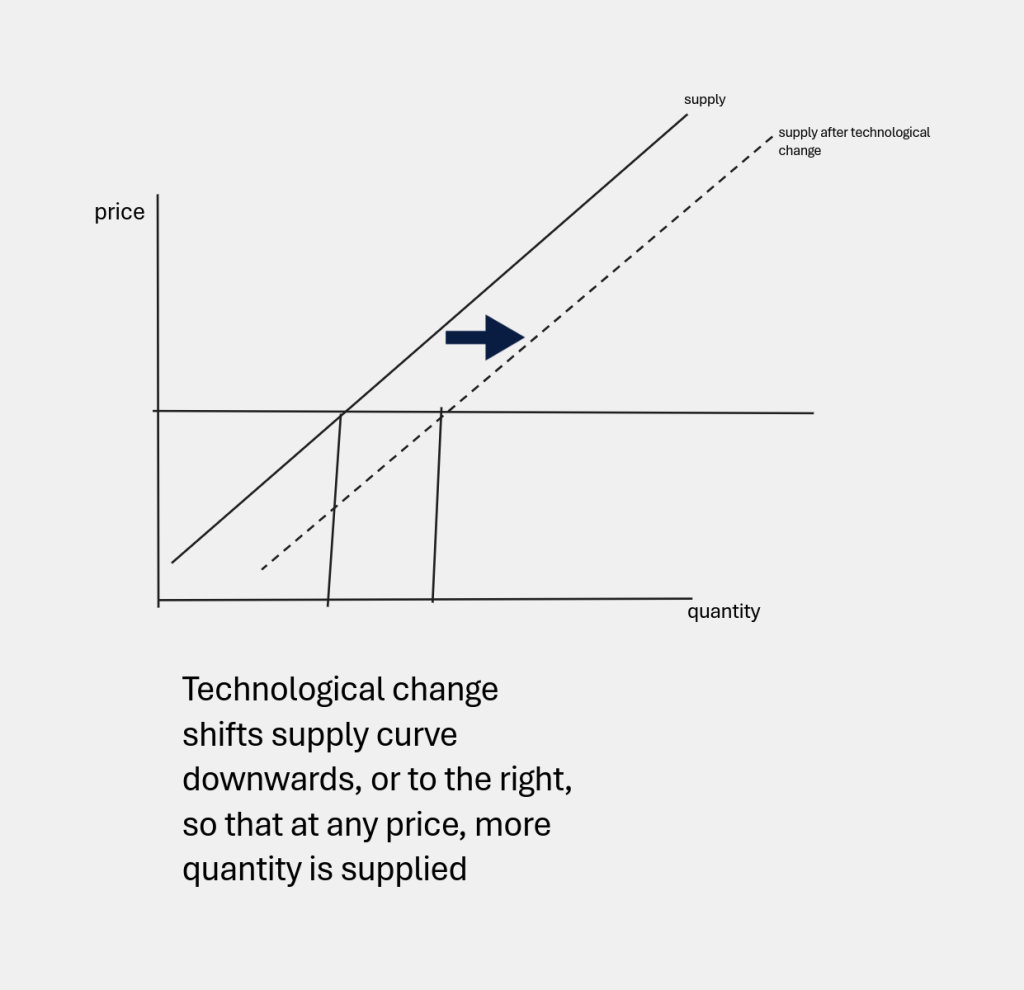
Typically, supply curves for various goods can shift from changes in the costs of their inputs. When the price of oil goes up, the cost of producing anything that uses oil inputs (like plastics) goes up, shifting the supply curve for Legos, for instance upwards, or to the left. If the product has a big transportation component, like some farm goods, an increase in the cost of fuel will shift the farm goods supply curve upward or to the left. The supply curve for many types of home computers has shifted to the right over time thanks to the lowered costs of components, like the cost of computer chips. Technological change often makes the cost of production of modern goods decline, shifting their supply curve to the right.
Shifting demand curves
Turning to the demand side, let’s see what will shift our demand curves, resulting in greater or smaller quantities being desired at any given price:
First, changes in consumer tastes (our new passion for dark chocolate, or our suspicion of foods with trans-fats) are always shifting curves. The weather (snowstorms, rain, heat waves) shifts demand for many goods, from rock salt for melting driveways to air conditioner sales. News about unsafe products decreases demand for them. When we think about shifts of our demand curves, there are a few particular situations that account for many curve shifts: changes in our income, and changes in the prices of related goods, particularly substitutes and complements.
Changes in income may shift demand curves
First, let’s consider changes in our incomes.
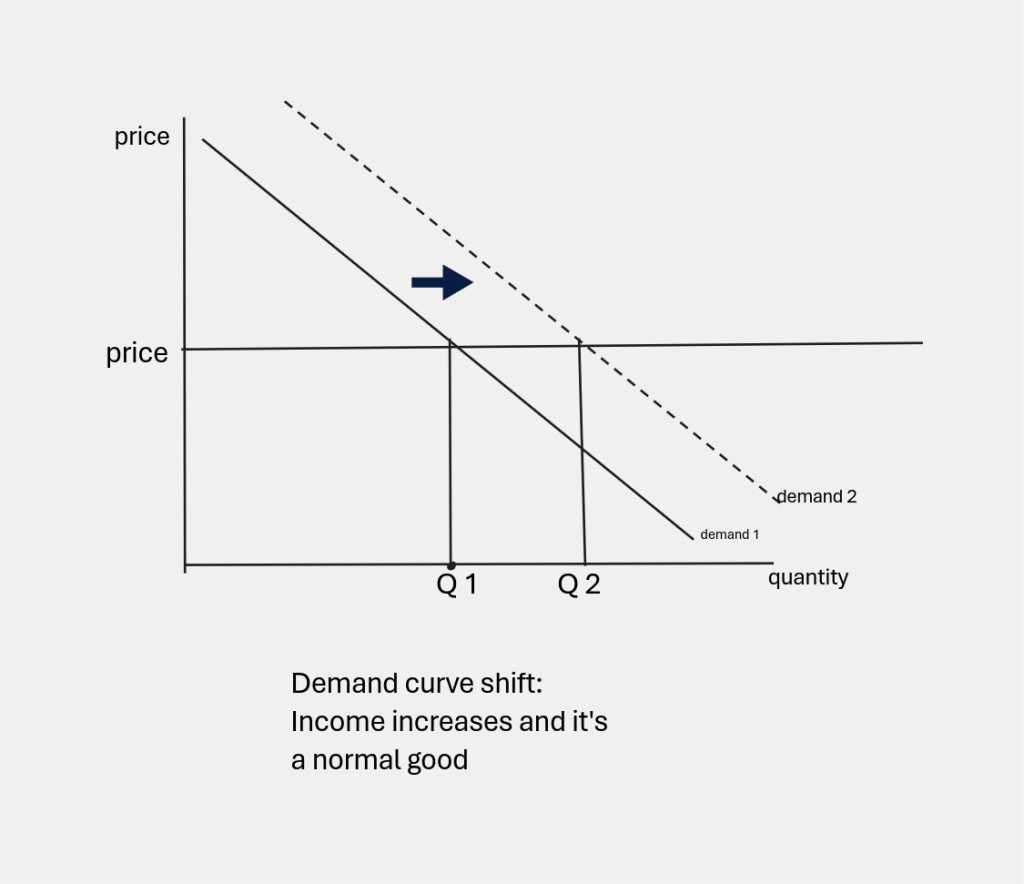
When someone wins the lottery, news reporters always ask, ‘What are you going to buy now that you’re rich?’ While there’s often a front page article on the winner who wants to give a chunk of money to a charity, there’s the occasional winner who declares he’s buying a year’s worth of cheeseburgers! However wacky the stories get—and they’re great reading—we expect that an increase in income will mean a change in shopping behavior. So, how do we evaluate the impact of a change in income on our demand curve for something? Usually, it’s relevant. So we go to the second question—is the change in our income the variable on either axis? No—the price and quantity of a good or service is on the axes, not our income. So, we believe we will shift our demand curves for some particular good or service.
Now the big question: which direction do we shift our demand curve? If you were suddenly rich, you can imagine wanting to buy more of many things: computer gear, jewelry, restaurant meals, gym memberships, good dental work, cars…the list seems endless. If your income increases and you decide to buy more of some good or service, we call this a normal good. For normal goods, an increase in income will shift our demand curve upward, or to the right.
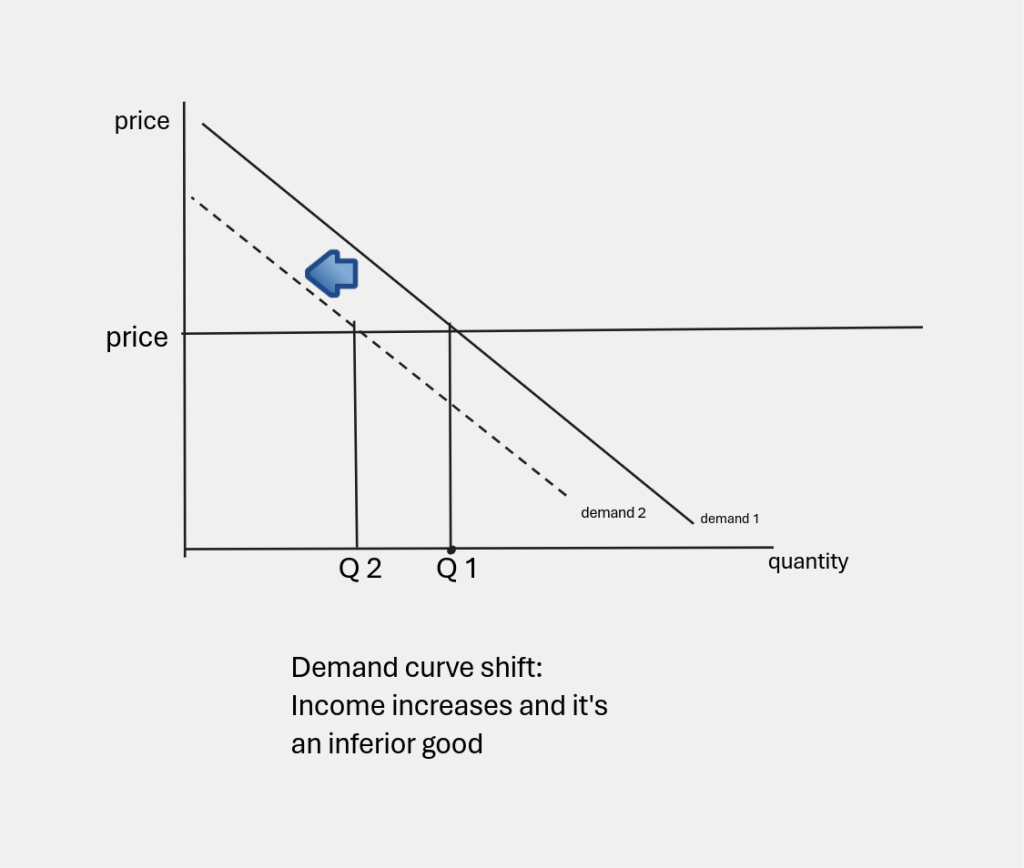
It is also true that if we were suddenly rich, there are some things we would never want to buy again. Some people say if they got rich, they would quit buying public transportation. Others might decide not to drive to their vacation destinations anymore, but to fly instead. Maybe we haven’t won the lottery, but we may have had that moment in the grocery store when we’ve got more money than usual, and we walk away from the aisle with the ramen noodles. Ramen noodles can be delicious, but if they remind us of being broke, we might buy less of them when we have more income. Goods or services that we buy less of, when our income goes up, are called inferior goods. Our demand curves for inferior goods or services shift downward, or to the left when our incomes increase.
Changes in the price of related goods–substitutes and complements–can shift demand curves
Our demand curves can also shift from changes in the prices of another good–something that is either a substitute or complement. Let’s first consider complements, goods that go together. If you can’t enjoy French fries without ketchup, then fries and ketchup are complements. If you always buy buns when you buy burgers, then burgers and buns are complements.
Imagine you go to the grocery store and you see there’s a sale on burgers. You put a lot of burgers in your cart and then you think, I am buying all these burgers, I need more French fries! They go together! How do I show a change in my demand for fries when there’s a sale on burgers?
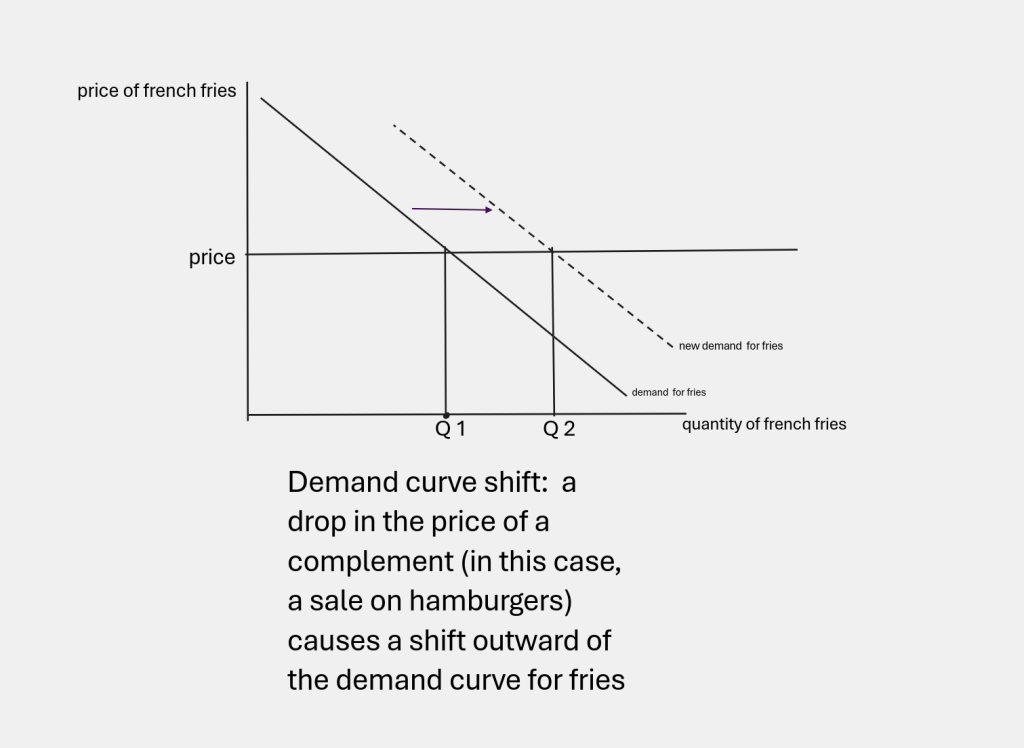
I use my 3-step method. Is a sale on burgers relevant to my demand for fries? Yes, to me they go together, they’re complements. Is a sale on burgers (or the price of burgers) on either axis? No. So I’m shifting a curve. And I’m shifting a demand curve, because all the talk is about shopping, which is demand behavior. If I shift my demand curve for fries downward, it means I demand LESS fries at any given price…but I know I want MORE fries at any given price, so I am shifting my demand for fires curve upward, or to the right.
Changes in the price of a substitute will also shift a demand curve. Let’s go back to our substitutes, coffee and tea. This time we are going to the store to buy coffee, but coffee has gone up in price! How will that impact my demand curve for tea? Let’s use the 3-step method. Is an increase in coffee prices relevant? Yes (because I said I consider them substitutes). Is coffee price increase on either axis? No. So I will shift a curve. Which curve? All the talk has been about my shopping—and that’s demand-side talk. So I know I am shifting a demand curve. And since I will now be buying more tea at any given price, I am shifting my tea demand curve upward, or to the right.
So, changes in tastes, changes in income and changes in the prices of related goods may shift demand curves in either direction. Supply curves may also shift, from changes in technology, or from changes in input costs. When the supply and/or demand curves shift, we may see a new equilibrium market price and quantity. This is actually one of the advantages of a market system over a ‘planned’ economy—changing prices allow resources to flow to where they will be valued the most. Changing prices guide the flow of goods and services to those who are willing to pay the most for them (we used to say, prices guide goods to those who need them the most, but they’re really going to the highest bidder, which isn’t the same thing). In some situations, however, our society may decide to over-ride the market system and allocate resources and goods according to our social values. We’ll explore “price controls “ in a later chapter. There’s still more to explore in our basic supply and demand model.
Some Useful Materials
A few short videos to help supply and demand come alive:
Media Attributions
- Fishmonger at Marco’s, South Philadelphia © Carol M. Highsmith is licensed under a Public Domain license
- demand-curve-individual © Bettina Berch is licensed under a CC BY-NC (Attribution NonCommercial) license
- demand-curve-market © Bettina Berch is licensed under a CC BY-NC (Attribution NonCommercial) license
- supply-curve-individual © Bettina Berch is licensed under a CC BY-NC (Attribution NonCommercial) license
- supply-curve-market © Bettina Berch is licensed under a CC BY-NC (Attribution NonCommercial) license
- demand-supply-equilibrium © Bettina Berch is licensed under a CC BY-NC (Attribution NonCommercial) license
- V-day-demand © Bettina Berch is licensed under a CC BY-NC (Attribution NonCommercial) license
- Valentine’s-day-supply © Bettina Berch is licensed under a CC BY-NC (Attribution NonCommercial) license
- V-day-equilibrium © Bettina Berch is licensed under a CC BY-NC (Attribution NonCommercial) license
- Moving versus shifting curves © Bettina Berch is licensed under a CC BY-NC (Attribution NonCommercial) license
- the three step process © Bettina Berch is licensed under a CC BY-NC (Attribution NonCommercial) license
- Practice doing move versus shift © Bettina Berch is licensed under a CC BY-NC (Attribution NonCommercial) license
- meaning of a supply curve shift © Bettina Berch is licensed under a CC BY-NC (Attribution NonCommercial) license
- Supply curve shift, technological change © Bettina Berch is licensed under a CC BY-NC (Attribution NonCommercial) license
- supply shift, increase cost of inputs © Bettina Berch is licensed under a CC BY-NC (Attribution NonCommercial) license
- meaning of a demand curve shift © Bettina Berch is licensed under a CC BY-NC (Attribution NonCommercial) license
- D shift, Income increase and inferior good © Bettina Berch is licensed under a CC BY-NC (Attribution NonCommercial) license
- D curve shift, Income increase and normal good © Bettina Berch is licensed under a CC BY-NC (Attribution NonCommercial) license
- Demand curve shift: change in price of a complement © Bettina Berch is licensed under a CC BY-NC (Attribution NonCommercial) license
- D shift, change in price of a substitute © Bettina Berch is licensed under a CC BY-NC (Attribution NonCommercial) license
