Preface
Bettina Berch
Consider this
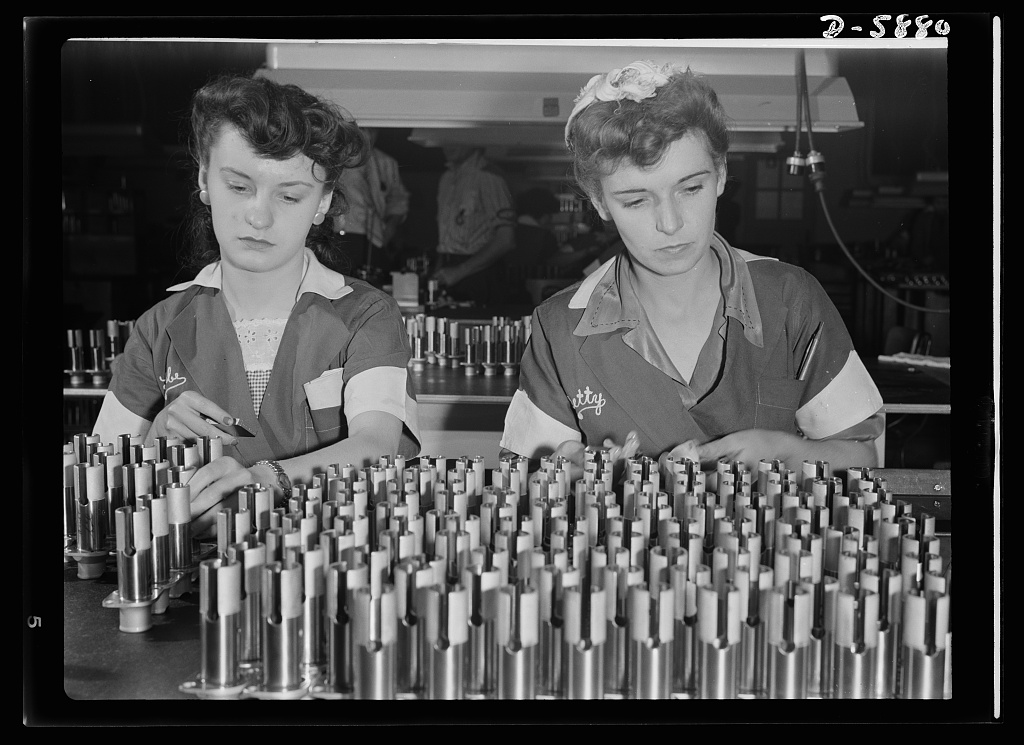
Photos like this were meant to encourage women to work in war factories, even though neither woman is looking at the viewer or looking particularly cheerful. Do you think it was more effective that way?
Accessibility Statement
Knowledge should be available to everyone, so the creation of free, open, and accessible educational resources is important.
The web version of Macroeconomics: The Big Picture has been designed to try to meet current accessibility standards. For instance, we use headings in each chapter to make navigation easy. Screen-reader-users can access content using a keyboard. Links, headings, and tables are formatted to work with screen readers. There is a way to change font size.
The real challenge are the illustrations, which screen-readers can’t manage. In this book, any image that’s giving you necessary information, also has “alternate text,” usually a sentence or two explaining what others are seeing. The question of how to “explain” a graph forced me to think about the role of graphs in modern economics textbooks and classrooms. Did the “father” of economics, Adam Smith, use graphs in The Wealth of Nations? No! As I re-examined this manuscript, I realized I had mostly been using graphs as a visual summary of what I had just been explaining in the text. The graphs repeat the point in a different way. I do think this text could stand without graphs.
In the end, I decided to include my graphs, both for the benefit of visual learners (for whom text can be challenging) and for all of us who believe more is better!
Also, readers relying on screen-readers could submit these graphs to an artificial intelligence program and ask for a description. When I submitted a random graph from the text to Gemini, I received this response:

Clearly there are knowledge-enhancing aspects to artificial intelligence! Ultimately, it would be great to incorporate tactile graphics to make the graphs physically readable to people with visual disabilities.
But nothing’s perfect. If there are problems, reach out to the people running the platform (for instance, Rachael.Nevins@cuny.com).
Acknowledgements
I have so many people to thank. I have had great technical and aesthetic counsel from Rachael Nevins. My first OER mentor, Jean Amaral, still inspires me in this work. Andrew McKinney and the whole CUNY-OER team have given me the encouragement to make this book happen. My BMCC students are a constant reminder that economics shouldn’t be so over-complicated that no one can understand anything.
Any errors in this book are my own responsibility.
Writing a book is a marathon, so having friends is a big help. Many thanks to Tamara and Martin Green, Ellen Tucker, Ellen Rockmuller, Donna Tapper, Barrie and Jerry Raik, Jane Head, Doris Ullendorf, Jill Goodman, Mel Bukiet, Charlie Davidson, Rachel Theilheimer, Carla Cappetti, Moe Imerukaj, Alan Rosenstein, Ken Gorfinkle, Atina Grossmann, Margo Singer, and Paul and Mark Berch. My apologies in advance to anyone I’ve omitted.
This book is dedicated to Seferina Berch.
Media Attributions
- War time workers © Ann Rosener is licensed under a Public Domain license
- Screenshot 2024-03-31 at 12.59.49 PM © Bettina Berch is licensed under a CC BY-NC (Attribution NonCommercial) license
