13 Production and Growth
Bettina Berch
Consider this
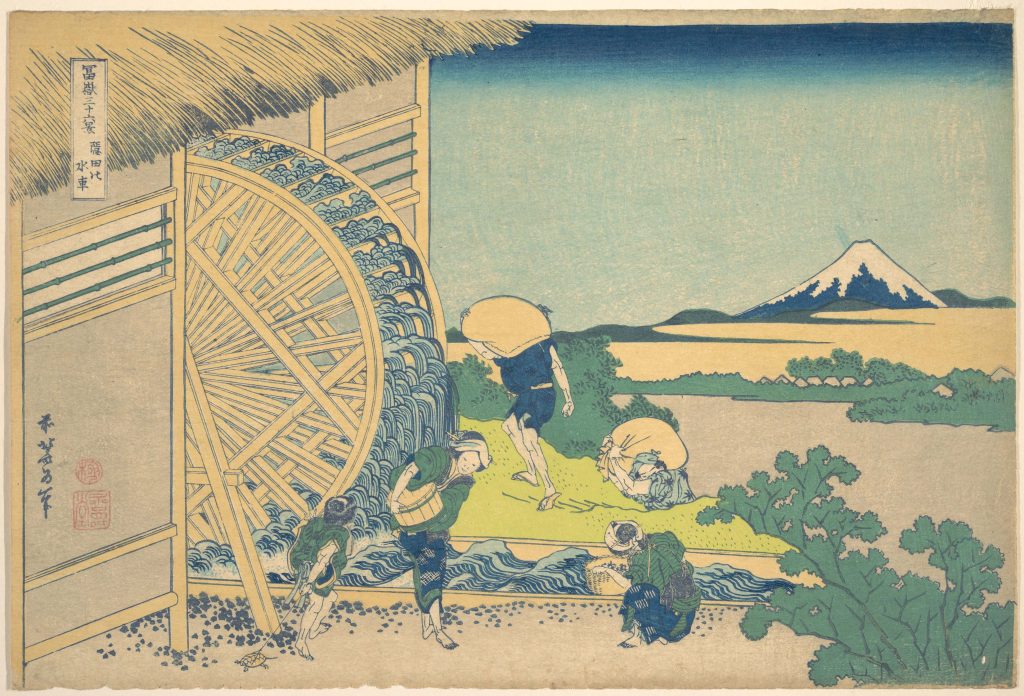
In the “golden age of capitalism,” 1950-1973, Japan had a growth rate of 8%, one of the highest in the world, in spite of having hardly any natural resources! Indeed, before Japan’s industrial revolution, they relied on water wheels as their primary power source, and even their water wheels were largely imported. So what’s their ‘secret sauce?’ How did Japan achieve such high growth rates? How does any economy do it?
What is Economic Growth?
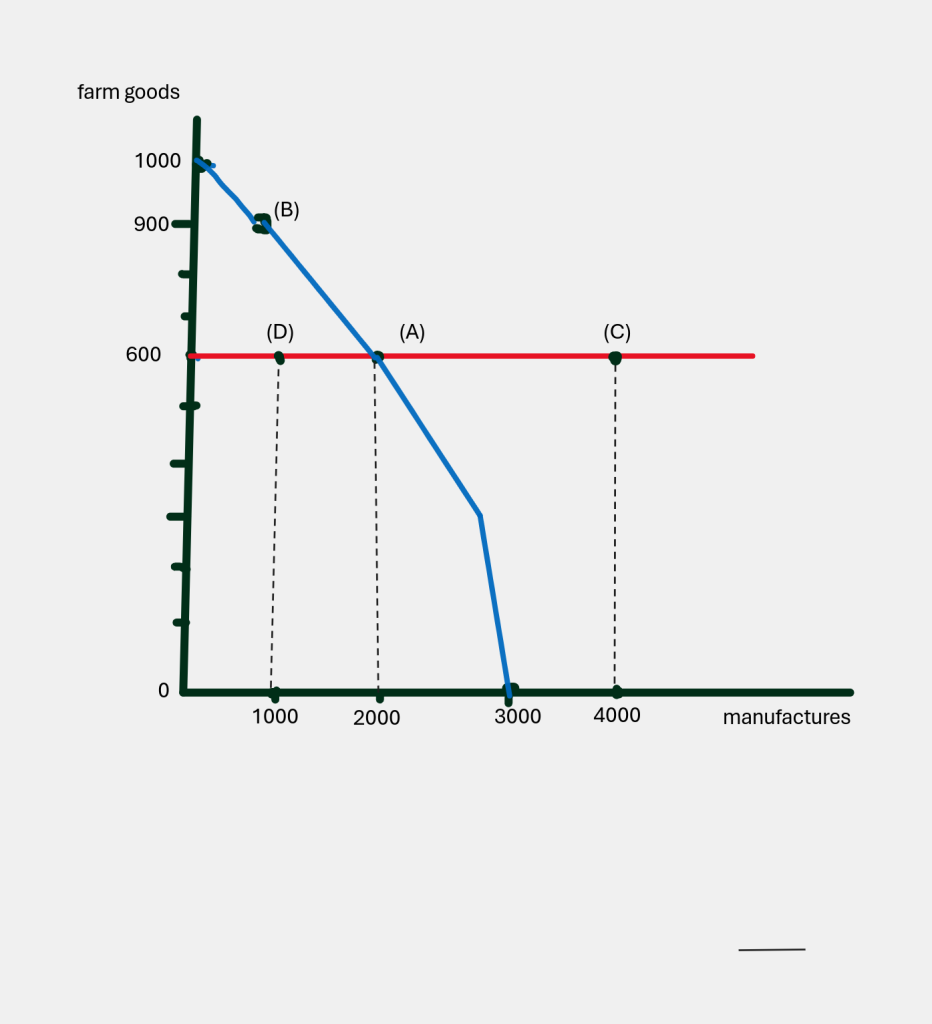
Do you remember back in chapter 2, when we introduced the production possibilities frontier? We said this line described all the potential output our economy could produce, given our resources and our level of technology. Inside the frontier, all the points were inefficient. Outside the frontier, all the points were not possible, unattainable.
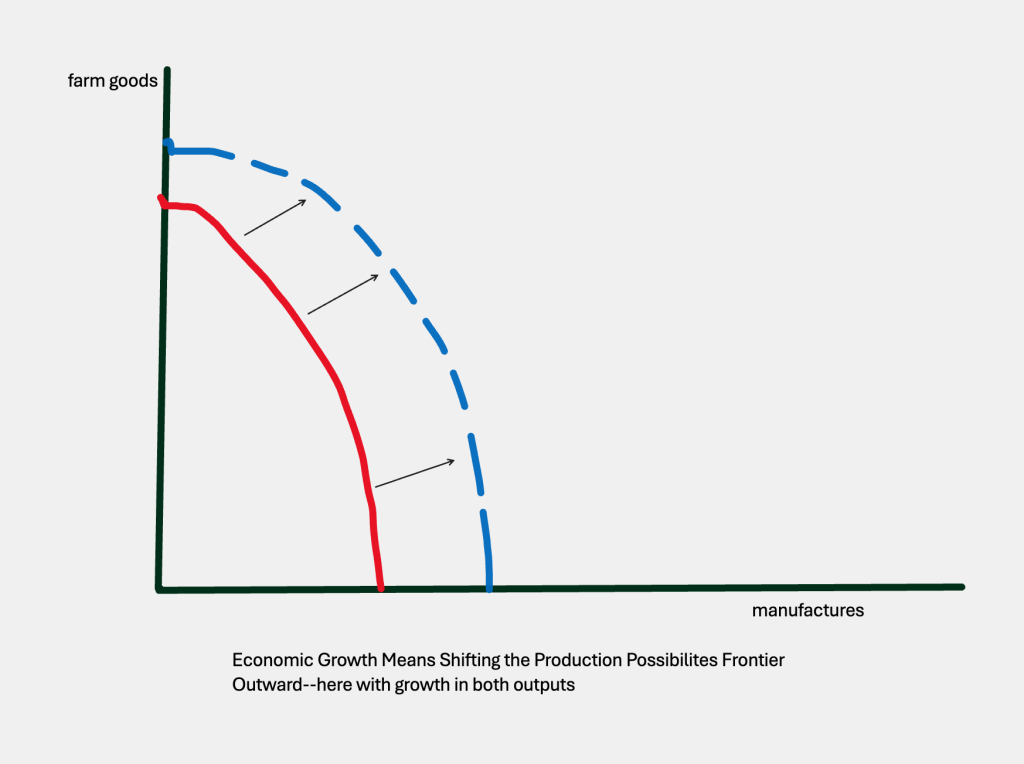
Now, when we talk about economic growth, we can go back to this model and draw in a new production possibilities frontier that shows economic growth: getting more of one or both of our two types of products, farm goods and manufactures.
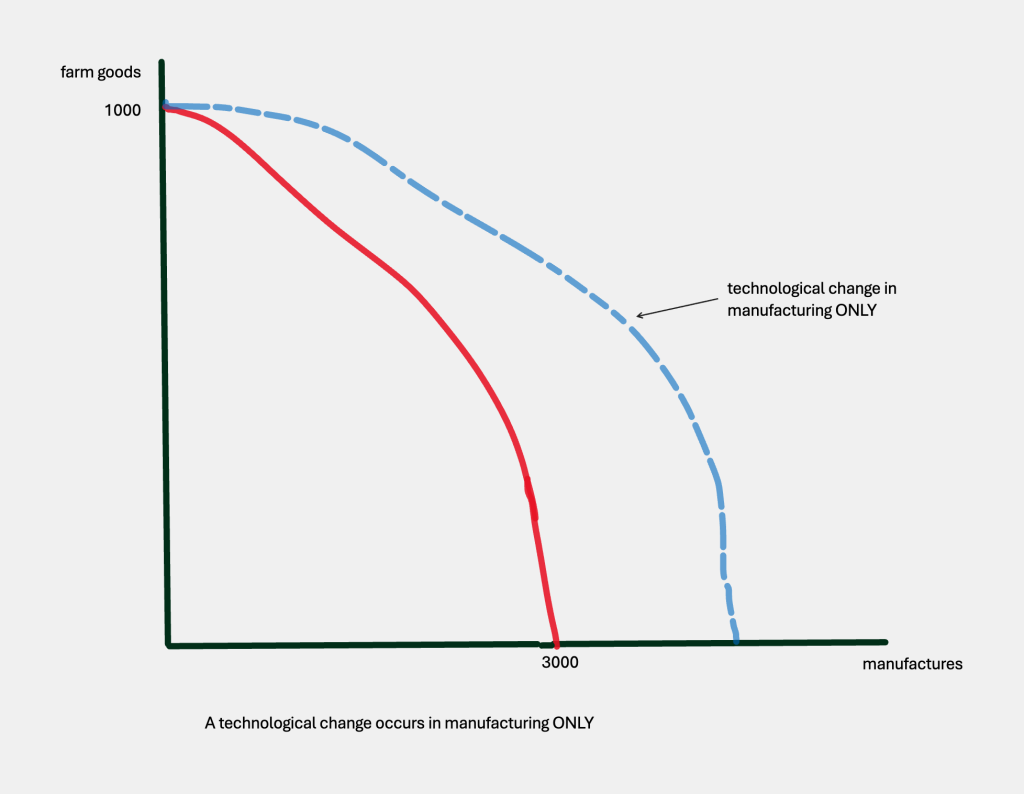
More generally, we could picture the production possibilities frontier shifting outward from both axes, indicating improvements in producing farm goods and manufactured goods:
In the real world, there are many ways we could quantify growth, and we often use the annual growth rate of real GDP per person. According to the World Bank’s 2021 data, some of the fastest growing economies in the world are the Maldives at 39.8% and Libya, with a 29.8% GDP growth rate per capita. At which point, you might be thinking, where???? by how much???? The problem with those figures, is that countries starting at a low point can score high growth rates with a few small improvements (part of what the catch up effect is about). An already developed country would have to work very hard just to show a small increase. Not only that, a one year short term increase might not be as meaningful as a steady growth rate over a long period of time. If we take average growth rates over a long period, like the twentieth century, we might have something more meaningful. Now we’ll see Japan topping the charts with a 2.65% annual growth rate over the course of the century, followed by Brazil at 2.43%, Germany at 2.06%, China at 2.15%. the U.S. at 1.77% and Bangladesh at .96%. This gives you an idea of the range of growth rates that are realistic (2.65%–.96%) and also how a few decimal points difference in growth rates can make a huge difference in living standards on the ground.
What determines how much an economy can produce? The production function!
We call the relationship between the inputs into production and the amount of output, the production function. We write it like this:
Y = t* ƒ (K, H, L, N) where
Y = real output of the economy
t* = the level of technology the economy is operating at (like analog, digital, nuclear tech, etc)
K = physical capital (like machinery and other ‘capital goods’)
H = human capital (like education, nutrition, skills, the ‘enhanced human’)
L = the number of workers (the number of people working, regardless of their skills)
N = natural resources (energy sources like fossil fuels and renewables, minerals)
The production function says that if we combine our inputs (K, H, L, and N) at the current state of technology t*, and do this efficiently, we can produce the amount Y of goods and services. You can think of this Y defining the maximum capacity of our economy, or what we will be calling ‘full employment.’
The production function is a real, not a nominal relationship
One important aspect of the production function, is that it is a real relationship, not a nominal one. This means that prices of inputs and prices of outputs can change, but if the stated amounts of inputs are combined at the stated level of technology, we will get the same amount of output no matter how prices change. One way to understand this, is to think of a production function like a recipe–where certain amounts of ingredients are combined using certain types of technology to get some number of servings of food. Look at grandma’s brownie recipe:

Her recipe lists amounts of various inputs, baked in an oven (our technology), resulting in 9 brownies. The prices of inputs can change over time–but you can still use her recipe and you will get 9 brownies. It’s a real, not a nominal relationship. Just like our production function.
How can a country increase Y (real output)? Let’s start by increasing K…
To increase Y, we will have to increase our capital stock, increase our human capital, increase our number of workers, increase our natural resources, and/or improve our technology. Let’s consider each in turn.
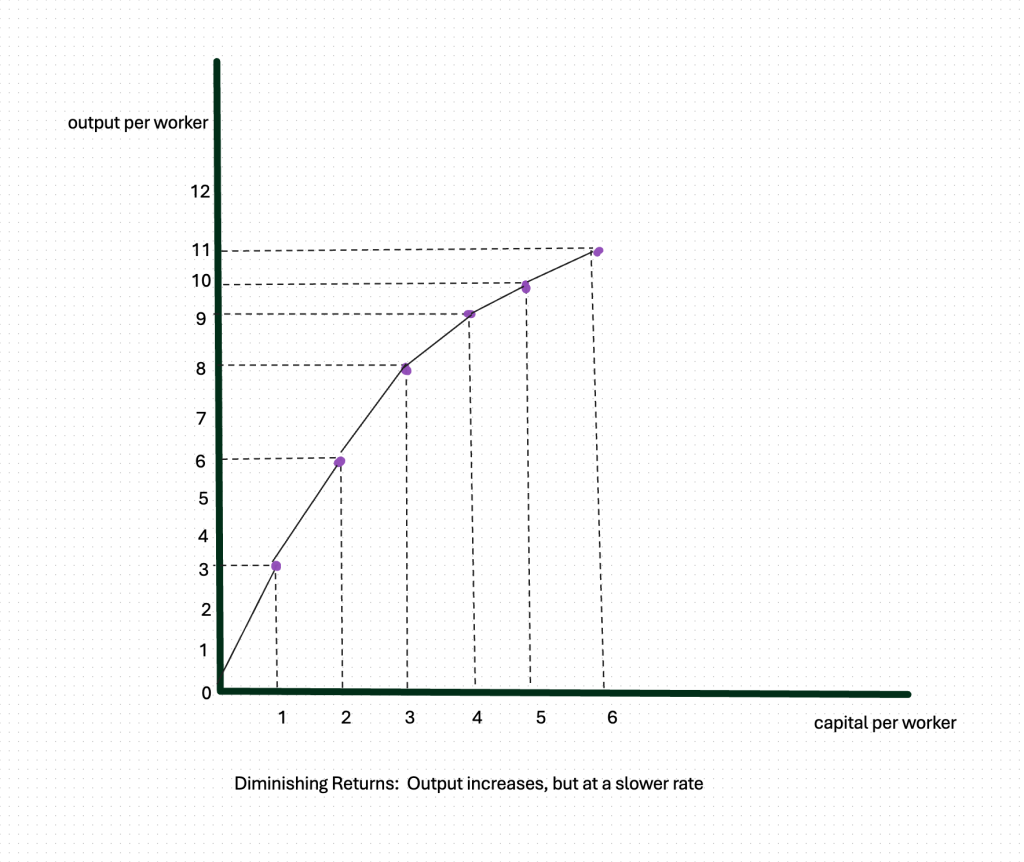
When developing countries are trying to grow faster, policy makers always used to tell them to increase their K, their capital. Build more factories! And while adding more units of capital can increase output, there are limits. Add more and more units of capital, and something called ‘diminishing returns’ set in, where output increases, but at a slower rate. How does this work? Imagine I leave the city to go to a cabin by a river, deep in the forests of New Jersey. After I arrive, I go out and look at the river, where I can see fish, but I can’t catch any with my bare hands. I need capital, tools! To kill my appetite that night, I look around in the shed, where I find a hand-line. The next day I go out to the river, drop in my line, and by the end of the day, I have caught 3 fish. That night, I go to the shed, find another hand-line, and the next day, with 2 pieces of capital, I catch 6 fish. That night I find a fishing pole, so I go out the next day with 3 tools and this continues until I am trying to use two hand-lines and 4 fishing poles. My output is increasing, but at a slower rate. You know why! I cannot manage 6 lines very well with only my 2 hands.
| # units of capital | output (fish) |
| 0 | 0 |
| 1 | 3 |
| 2 | 6 |
| 3 | 8 |
| 4 | 9 |
| 5 | 10 |
| 6 | 11 |
We could graph these results:
What about increasing H, or Human Capital?
Another typical bit of advice to countries trying to increase their growth rates, is to increase their H, or human capital. Make sure everyone has good health care and basic nutrition. Send children under 16 to school, instead of putting them to work in factories! And while better health and education often improves a country’s standard of living, and its productivity, it’s not without costs. In many parts of the world, sending children to school involves direct costs (tuition, uniforms, books, transportation, room and board) and indirect costs (the money they would have made working ). A family might not be able to afford that for all their children. So maybe the smartest child is sent to school, while the others work harder to cover the extra costs. Maybe this child is so successful they win a scholarship to study in England or America. And after they graduate with many wonderful advanced degrees…are they really going to go home, where there are no jobs for young women with doctorates in nuclear physics? This situation is often called brain drain, when the best-and-brightest just can’t see a future for themselves returning to their home country. This is not an argument against education, just a warning that improving human capital is not as simple as it looks.
What about increasing L, or the number of workers?
We can increase L two ways–either by including more of our existing adult population in the labor force, or by bringing new people into the country. If our country discourages women from entering the labor force, and we reversed that policy, we could increase L and not even add ‘more mouths to feed.’ Opening the labor force to women, would not only increase L but also the H, or human capital, that they may have. Or, we could encourage more immigration to the country. And since immigrants are usually ambitious and often quite skilled, they too will bring human capital as well as sheer labor power. At times in history various countries have realized they needed more L and have started programs to bring in foreign workers ( German’s Gastarbeiter program from 1955-1973; America’s H2-A farm worker visa program). Political opposition to these programs often comes from xenophobic right-wingers, or from labor unions, so this too is not as simple as it should be.
Is increasing N the only ‘safe’ option to get increased Y?
You’d think it would be such an advantage in this world to have lots of natural resources! Then you look at the history of some of the countries that have diamonds, gold, titanium, and other precious metals, and the wars they have endured, either from colonial powers or from eager-to-invade-and-plunder neighbors. It’s not just ‘blood diamonds’ and ‘conflict timber,’ there’s a growing list of important minerals– tantalum, tin, tungsten and others–that spark wars and other problems. Some economists have called this the ‘resource curse’ and it’s in the news every time some impoverished country strikes oil. It has been argued that if the African continent had had no valuable resources, European colonial powers probably would not have invaded and ruled for as long as they did. Not only can natural resources invite war, the lack of natural resources hasn’t prevented some countries from achieving high growth–Israel and Japan come to mind. Finally, there’s a larger question of what we recognize as a natural resource. For centuries, fossil fuels have been important natural resources–with extensive technology developed for its extraction and refining. Only recently have wind and solar power become important natural resources, and we’re still in the early days of their efficient utilization. (Why? Most likely because the temperate zones have more fossil fuel reserves than the tropical zone, which has access to more wind and solar.) Indeed, focusing on natural resources leads us to considering one term in the production function that we have not discussed–technology.
How big a role does technological change play in economic growth?
Technological improvements surround our daily life, so much so, that it’s hard to imagine quantifying their importance. But one Nobel-prize winning economist, Professor William Nordhaus, decided to tackle the question. He decided to look at the history of how we make light, since having light makes a lot of things in life possible. After researching the most typical light technologies, from ‘caveman days’ to the modern era, he reproduced these methods in the laboratory, to see how much human labor it took to produce 1,000 lumen hours of light with each technology, where 1 lumen is defined as the light produced by 1 candle. Here, in condensed form, are some of his results:
| Time Period | Light Source | Labor Price (hours to produce 1,000 lumen-hours of light) |
| 500,000 BC | open fire | 58 hours |
| 1750 BC (Bible days!) | Babylonian lamp (clay version of the Aladdin lamp) | 41.5 hours |
| 1800 AD (Middle Ages) | tallow candle (animal fat mixed with ash) | 5.4 hours |
| 1900 AD | filament lamp (first light bulbs) | 0.2 hours |
| 1990 AD | filament lamp (modern light bulb, not digital tho) | 0.0006 hours |
This small table shows a remarkable advance of technology in one of the most important features of human life, the ability to make light. But we could also trace the rise in the production of books over the course of centuries: from scribes in monasteries, who took some 136 days to copy one book, to the printing press of the 1440s that could crank out 2.5 books per day, to steam-powered printing, producing 25 books a day, to the modern day, where countless books can be issued per day.
Even if there are technological innovations that don’t impress us, certainly advances in light and knowledge are important. So we need to ask: what stimulates technological innovation? Why are some countries leaders and others followers–or worse, copiers?
What stimulates technological change?
For a long time, economists have argued that a strong patent system was the best way to stimulate innovation. Did you realize that patent and copyright protection was written into the U.S. Constitution? It’s Article I, Section 8, Clause 8, that says our Congress shall have the power “to promote the Progress of Science and useful Arts, by securing for limited Times to Authors and Inventors the exclusive Right to their respective Writings and Discoveries.” We know that many of our founders (think Benjamin Franklin and Thomas Jefferson) were themselves inventors and writers, but what’s the economist’s argument for patents?
Consider this situation. You are a business person and you’ve decided to stake your entire fortune on finding a cure for a terrible disease. Let’s say, sickle cell disease. You spend billions setting up laboratories and hiring expensive scientists. After ten years of work, one of your team finds a cure! Let’s call the cure, pill XYZ. Information about XYZ is published in the leading journals, and tested by the FDA. If there were no patent system, a whole crowd of manufacturers would now rush to produce and sell XYZ–cheaply. You put billions into the development of the cure, your results became public knowledge, and then you had no way to recuperate the money you spent on development. You decide never to fund research again! Technological innovation slows down.
Alternately, consider what happens when there’s a patent system. You put the billions into research, find the cure, publish the results for verification–and then you get a patent on your discovery. For the next 20 years, if anyone wants to produce XYZ, they have to rent a license from you. And you, seeing a nice return on your money, decide to tackle another disease. Technological change is stimulated.
Patents and copyrights give inventors property rights in their ideas. Their discovery (that cure for sickle cell, that treatment for cancer) became public knowledge as soon as it was tested and verified by others. A patent converts that public good into the private property of the inventor, allowing the inventor to go on to make more brilliant discoveries, more technological innovation. While this is accepted doctrine in the economics profession, it isn’t necessarily true–or true for all people. Professor Lisa Cook, studying the history of patents in the early twentieth century, shows that anti-black violence reduced patent rates for African Americans. Just having a patent system isn’t enough–the broader legal/cultural infrastructure is critical as well.
In recent years, the doctrine of ‘patents promote innovation’ has been challenged by the ‘open source’ movement. Open source argues that by letting others examine the computer code, modify the book, or redesign the product–the original process or product is improved. You may be familiar with Linux and Ubuntu, which are open source operating systems; even this book you are reading is an open source document. Open source rules the world of cocktails, of ‘signature dishes’ of famous chefs, and even tattoo flash. If you wanted, you could reconfigure some open source materials that others have created, and by doing so, you might be making an even better product. This is where the boost to productivity is supposed to kick in–people tinkering with the product, coming up with something better.
Which system stimulates more technological change? It might depend on the type of product we are considering. Pharmaceutical advances require high overhead costs, which may only be financed by the promise of a patent. Cultural advances may flourish better in the open source world, where the rewards may be more indirect (like fame).
How do we encourage specific types of technological change?
Apart from patents and personal fame, there are other ways to stimulate technological change. Governments can issue subsidies or grants to university researchers, which can be an effective way of funding the sort of basic research that doesn’t result in a marketable products, but furthers our understanding of things which could ultimately lead to products. Research on the origins of the universe, for example, is too abstract for many businesses to fund, but can ultimately lead to findings that a business might pursue, like building a viable space station. Another approach to innovation is the ‘world prize’ route: a world organization might announce a big prize for the first lab to develop an effective malaria vaccine, for example. The prize money would compensate the inventors for their work, releasing the use of the vaccine patent-free to any country that needed it, making it affordable.
Open source challenges, patents, subsidies, and prizes are each ways of stimulating innovation. They may function differently, but once something’s invented, it spreads around the world. And as we shall see when we discuss developing countries, technology invented in the developed world (like cellphones and basic computers) often allows developing countries to ‘leapfrog’ forward, producing what we call a ‘catch up’ effect, bringing developing countries closer, faster, to the developed world. It’s called ‘convergence.’
Some Useful Materials
A short video on patents vs. prizes vs. subsidies.
Patents from the ancient world to our own.
A podcast on patents and racism.
An argument that patents stimulate economic growth.
An argument in favor of open source.
Media Attributions
- Water Power © Hokusai is licensed under a Public Domain license
- Production Possibilities Frontier, with inefficient, efficient and impossible points © Bettina Berch is licensed under a CC BY-NC (Attribution NonCommercial) license
- production possibilities frontier shifts from tech change in one output © Bettina Berch is licensed under a CC BY-NC (Attribution NonCommercial) license
- Economic Growth seen as pp frontier shift © Bettina Berch is licensed under a CC BY-NC (Attribution NonCommercial) license
- Whiteboard © Bettina Berch is licensed under a CC BY-NC (Attribution NonCommercial) license
- Diminishing returns © Bettina Berch is licensed under a CC BY-NC (Attribution NonCommercial) license
