4 Diving Deeper Into the Curves: Elasticity and Welfare Analysis and What They Offer
Bettina Berch
Consider this
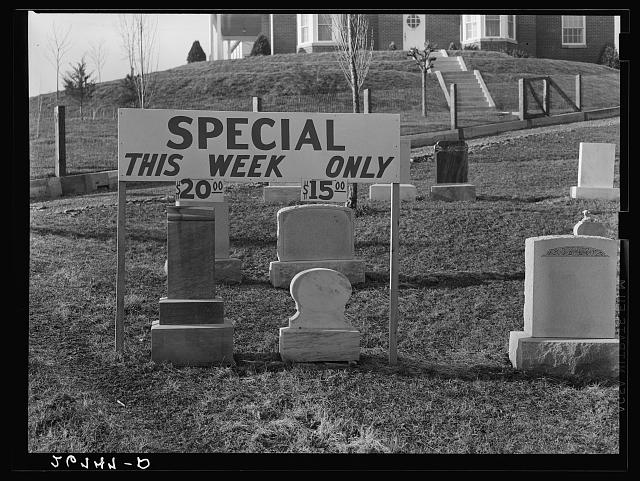
Why are we looking at a photo of tombstones on sale? Do you think sales went up after “this week’s special”? Or, in the terms of this chapter, are we “price elastic” when it comes to gravestones?
The shapes of curves (elasticity) and what difference it makes
Now that we’ve drawn our supply and demand curves with the information in our supply and demand schedules, it’s a good moment to step back and think about the shapes of these curves. Flat curves and steep curves mean different things. First, let’s see some relatively flat curves:
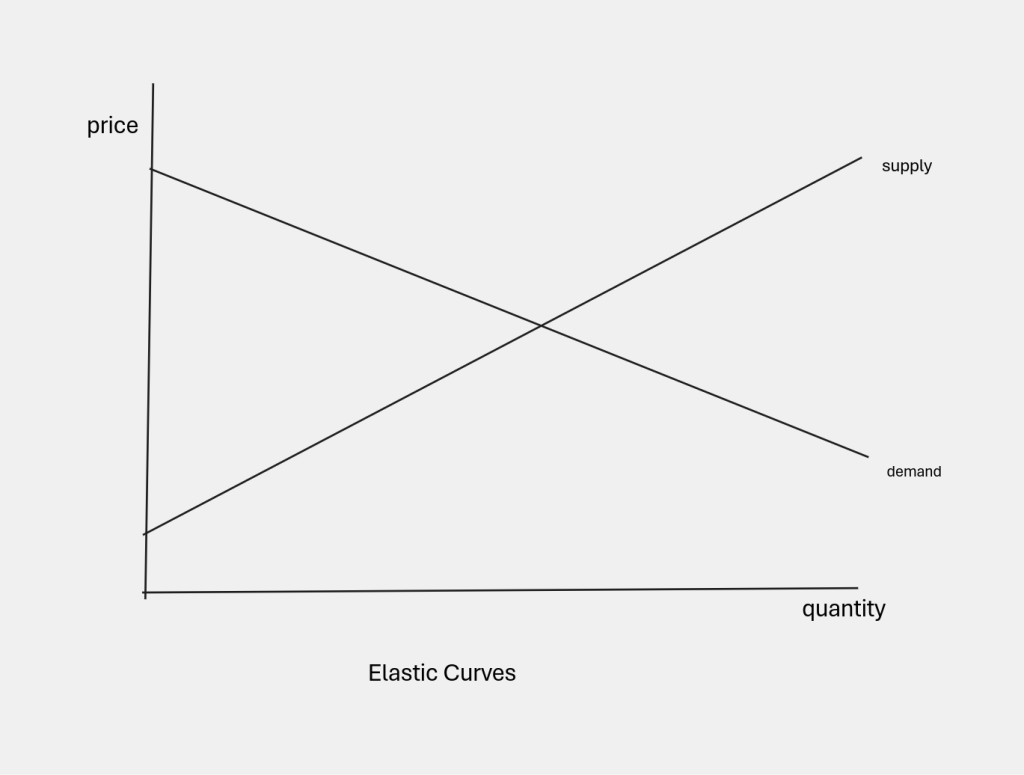
In the graph above, both our demand and our supply curves are relatively flat. A small change in price will produce a big change in the quantity demanded or supplied. These curves indicate that demand and supply are VERY price-responsive, very price-sensitive.
In the graph below, both our demand and supply curves are relatively steep. Even a big change in price won’t change very much the supply or demand for this good. Demand and supply are not very price-responsive, not very price-sensitive.
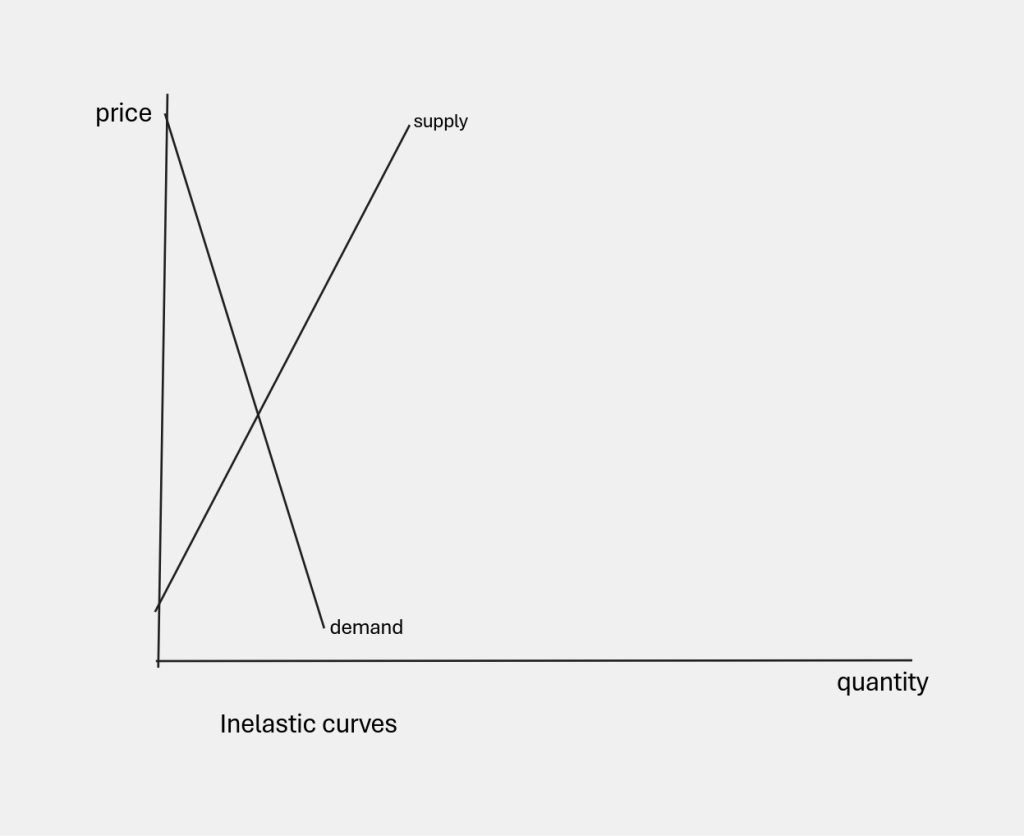
While in math we refer to the steepness of curves by talking about their slopes ( Δ price/ Δ quantity, with the symbol delta, Δ , meaning ‘change’), in economics we refer to the elasticity of our curves, which is defined as the Δ quantity / Δ price, expressed as an absolute value (meaning we drop the positive or negative sign). As you see, it’s the inverse of slope. Elasticity tells us how much change in quantity we’ll see from a change in price.
Price elasticity on the demand side
What kind of things will have relatively flat, or price-elastic demand curves? These will be the sort of things we are eager to buy if their price goes down, and things we won’t buy if their price goes up a bit. We’re price sensitive. When my usual cereal goes on sale, a small price cut makes me buy quite a few boxes. I don’t have to go on fancy holidays, but if I saw a ‘good’(meaning LOW) price, I’d consider it. If apples are more expensive than usual, I’ll buy pears. To me, they’re a good substitute.
In general, our demand for goods is price-elastic if
a) we have good substitutes for the item.
b) it’s an optional purchase, not a necessity.
Our demand for goods is price-inelastic if
a) very few good substitutes exist (You buy your child the cereal they love or it’s a total pain at breakfast. You buy the school uniform no matter what it costs to avoid trouble).
b) it’s a necessity (the doctor prescribes a particular medicine so you buy it and complain about the cost later; you buy salt and toilet paper when you run out even if the store is overcharging for it).
c) it’s an addictive substance (like cigarettes or narcotics) so when the price goes up you keep paying.
Now and then, elasticity makes the headlines. During the high inflation after Covid-19 receded, producers wanted to raise their prices on a lot of consumer goods, but knew there was a lot of ‘resistance’ to higher price tags (price elastic consumers.) So they decided to shrink the size of the package or bottle instead. (On some products, like breakfast cereals, it has worked over and over.)
Price elasticity on the supply side
While we are used to thinking about demand elasticity, supply curves can show price elasticity or inelasticity as well. In general, supply elasticity is a function of the time dimension. In the short run, an increase in market price can’t produce a big increase in supply. In the long run, there’s time for a lot of new manufacturers to enter the market. Likewise, if there’s a decrease in market price, many suppliers will stay in the market and see what happens, rather than leave. In the long-run, if they’re not able to cover costs at a lower price, they will leave.
Understanding the elasticity of curves can help business-owners understand when they should and when they should NOT raise prices to generate more revenue. It can also help policy-makers when they are trying to decide which programs, regulations, taxes, or tax credits will nudge people in the direction they want.
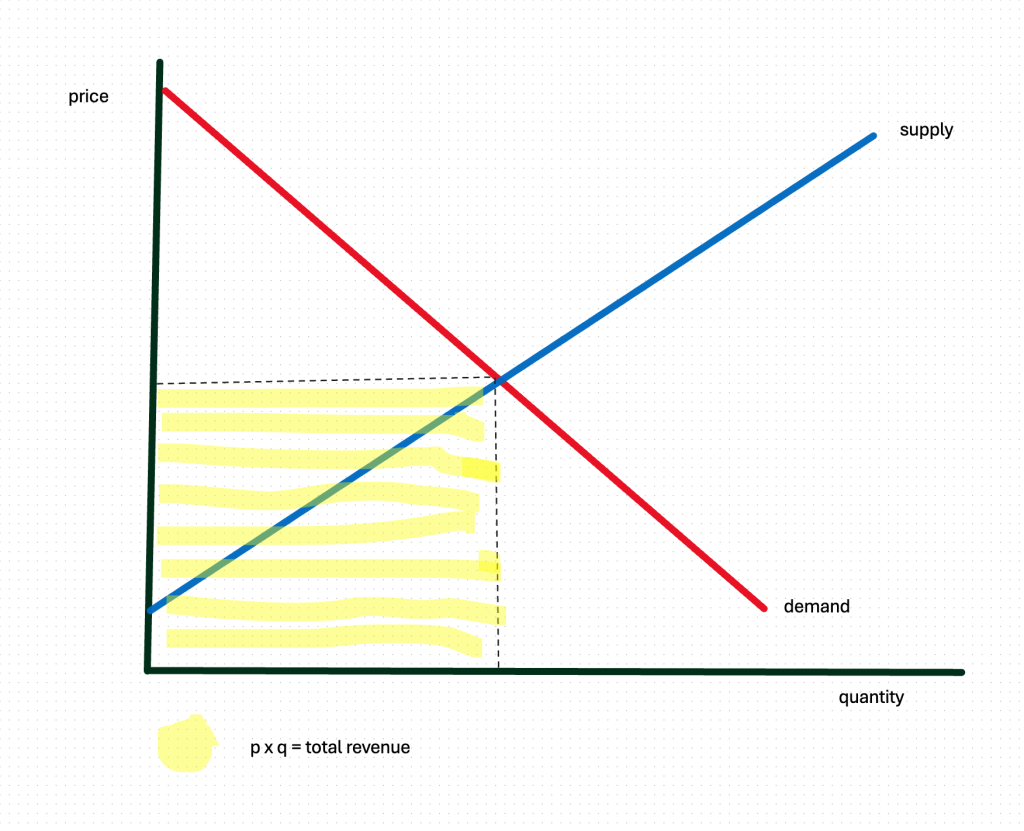
To see how elasticity plays into this, let’s look at one of the most basic consequences of a price change in a market—its impact on total revenues. The total revenues from any market are the price of the item times the total quantity sold—P x Q. On a graph, this is the shaded rectangle:
Knowing about elasticity can improve policy
Now, let’s imagine a market situation where total revenue and elasticity might be very important: the illegal drug industry. Imagine our initial supply and demand curves were for heroin. Since heroin is an addictive drug, we could assume its demand curve is price inelastic—people will buy it even when it goes up in price. Its supply curve is probably of normal elasticity. Now suppose the government spends its anti-drug funds on cutting down the supply of heroin—policing airports, border patrols, coast guard interception programs. We would draw our supply curve shifting upward, or to the left (supply 2):
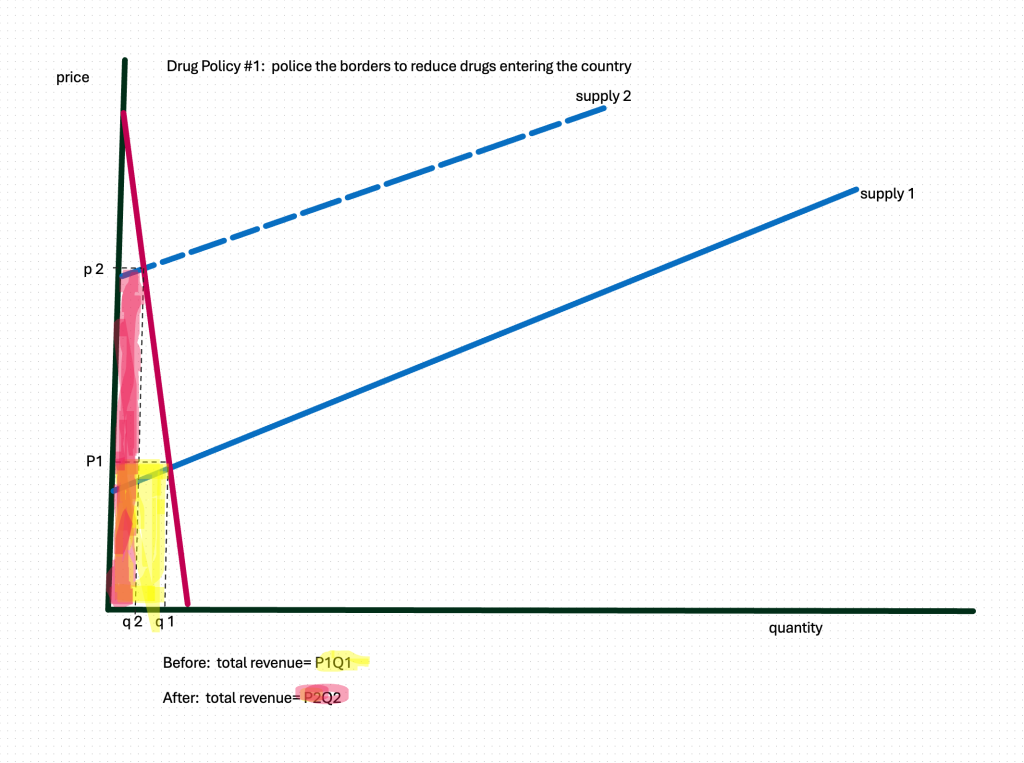
Government anti-drug efforts, by shifting our supply curve to the left, raises the price of heroin…which also increases total revenues to the industry! This is NOT good. Increased revenues in the heroin industry will only make it more attractive to new drug suppliers.
Given our inelastic demand curve, what other options for spending its funds does a well-meaning government have?
Imagine the government spent its anti-drug funds on reducing DEMAND for drugs—education programs in the schools, rehab programs for users, incentive programs for keeping clean. Let’s see how that shift from demand1 to demand 2 might look:

By reducing demand at any given price, we have also reduced total revenues in this industry. So, by knowing the elasticity of our supply and demand curves, we can design more effective social policies.
Welfare analysis: more insights into the meaning of market equilibrium
Welfare analysis, in economics, is NOT about what happens when the government sends out welfare checks to people. Welfare analysis examines some of the hidden benefits and costs of market pricing.
Let us go back to our basic supply and demand graph and consider that demand curve in a different way: all along the demand curve, there are people willing to pay different amounts for some particular thing. If this is a market for dog-walking services, there are people willing to pay hundreds of dollars for their dog’s walks, and people willing to pay only $10 or $20—or even $0. But because the market determines the price, you may have been willing to pay $75, but you get the dog-walking services for perhaps $50—whatever price the market has determined. The difference between the $75 you were willing to pay, and the market price of $50 is $25, which is your Consumer Surplus.

Likewise, on the supply side, there are start-up dogwalkers out there—maybe they’re new to big city prices—and they’re willing to walk a client’s dogs for $10 a week. Others are willing to walk dogs for $20, $30, $50, or $100 a week. All these ‘suppliers of dog walking services’ are represented by points on the supply curve.
The intersection of the supply and demand curve might give a market price of $50. Maybe you’d been willing to walk them for $10, but now the market is paying you $50. You are getting $40 of Producer Surplus.
On the graph above, all the area below the demand curve but above market price is defined as Consumer Surplus. All the area above the supply curve and below the market price is Producer Surplus. If we add together consumer surplus and producer surplus we get Total Surplus, which is at its maximum when the market price is at equilibrium.
While economists really like all this surplus and love it being maximized, you might find it a weird way to think about happiness. To get some understanding of what’s going on, let’s imagine a situation where prices are not determined by the market forces of supply and demand…but something else. Imagine you are walking around a souk or marketplace where there are no posted prices. Maybe you’re in a bazaar in Istanbul and a beautiful carpet catches your eye. The shopkeeper notices your interest, chats a bit, offers you a coffee, and then asks, “How much would you pay for this superb carpet?” In effect, he’s asking about your “willingness to pay.” (Maybe he would like some of your “consumer surplus” for himself!)
At this point, most people accustomed to shopping with price tags on everything (aka “market prices”) start feeling very nervous. Should I be honest, tell him how much I love his carpet? ? Should I lowball him like my friends advise? Many will simply thank the man for his coffee, walk away, and look for a “fixed price” store. And this is not necessarily a bad idea. Marketplace bargaining takes a lot of skill and experience. At the fixed price store, you will see price tags again—these prices might be higher than necessary, but they are definitely prices that these shopkeepers are willing to sell their carpets for.
There are many places in our modern economy where suppliers have decided to focus on extracting some of your consumer surplus. We are all familiar with “surge pricing” on car services like Uber, or airlines on high demand holidays. They know your “willingness to pay” is different at different times and they have collected enough data points on consumers to price their product accordingly. This is something in the real world we are all familiar with and now we have a name for it: trying to capture more of our Consumer Surplus.
Some ways to use welfare analysis
Welfare analysis has many applications. As we will see later on, when we examine the impact of taxation, or the gains and losses from world trade and tariffs, welfare analysis can clearly point out winners and losers from various policies. But there are a few more areas we can mention where this way of looking at the world can give us insights.
First, let’s talk about “free” things. You go online, you search the internet, you get lots of great information—and you don’t pay a cent. Maybe you’re looking up how to treat some skin rash, or whether to stand at the front or the back of the subway platform for where you want to go. Since the invention of the internet, we have all had access to information and experiences that, a long time ago, we would have been willing to pay a lot of money for. There are economists who have tried to estimate the value of all this “free” information we are constantly gathering—because even if it’s free, it often gives us great value, which we could quantify as “what we were willing to pay for that information minus what we had to pay.” And this is value that really ought to be included in our estimates of our GNP, right? Well, hold that thought until we get to measuring the GNP.
But let’s take the issue of “free” to another area, that place where things can’t be sold, they can only be donated. We are not allowed to sell our blood, just our plasma, so periodically we hear frantic appeals from the Red Cross urging us to donate more blood. In effect the ban on selling our blood means it has a price of zero—we must donate, not sell. We are also not allowed to sell, since the National Organ Transplant Act of 1984, our spare kidneys (most of us are born with 2 kidneys and only need one to function). Before this law passed, the equilibrium price of a kidney was $20,000. At that time, approximately 8,000 kidneys were donated per year, another 4,000 were purchased. After the 1984 law, no sales were allowed—so we have a zero price. This might please some people, who dislike the idea of people selling their body parts for money. But using welfare analysis, we can see who gains and who loses when we move from a market price of $20,000 to a market price of $0.
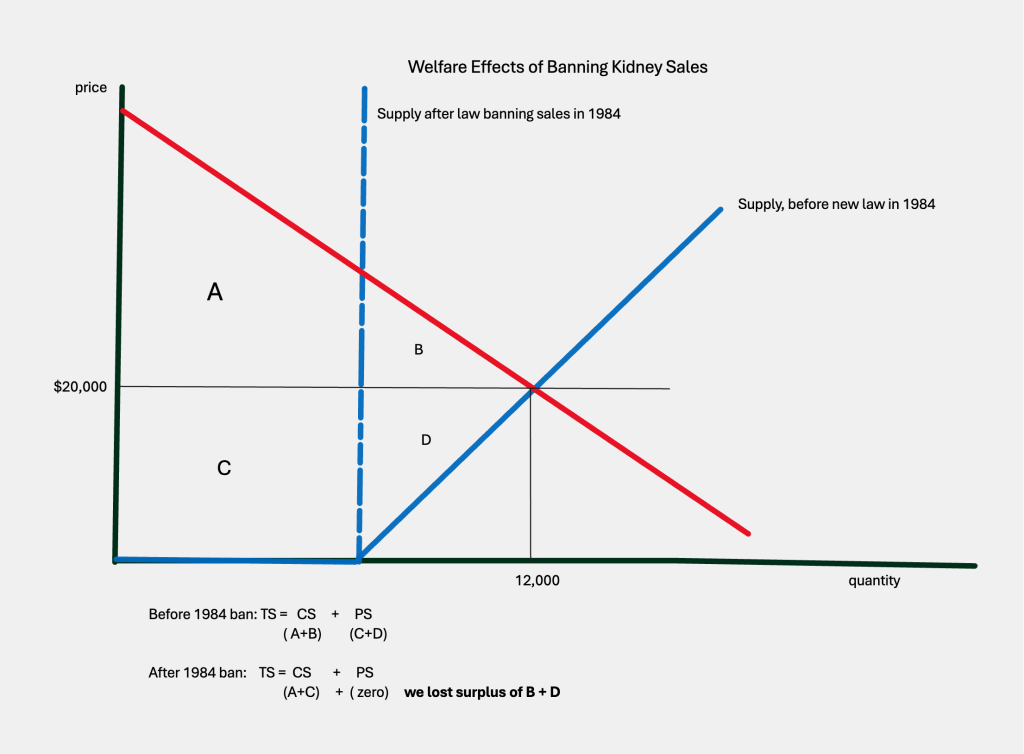
Before the 1984 law: Total Surplus = consumer surplus of A + B and producer surplus was C+ D.
After the law: Total Surplus = consumer surplus of A + C and producer surplus of 0 (zero).
We lost areas of surplus B + D. Why? Because there are people not willing to donate a kidney, but willing to sell one. Because we are not allowing those transactions to take place, society is losing some welfare, some benefit. If you’re like me, you hear this argument in favor of legalizing the sale of body organs, and your head starts spinning! I always thought it was more moral, more ethical to be opposed to the marketing of human organs. But welfare analysis made me wonder. Maybe it is more ethical to ensure the maximum number of transplants take place, and maybe that’s more important than preventing people from selling their spare parts.
It is important to notice—and it’s especially true here—that when we use a model, we simplify. We don’t take into account everything going on in the world. You could argue that banning the sale of organs encourages more people to donate a kidney, since this gift has become even more precious. Or you could argue that banning anything just drives sellers to the black market, increasing risky outcomes for all parties. In any case, it’s welfare analysis that helped us see who was gaining and who was losing from a change in the law—so it has its uses!
Some Useful Materials
In inflationary times, we start thinking hard about price elasticity! For example, read this article from the New York Times.
Understanding elasticity helps you sort out the impact of cutting gas taxes. Listen to this NPR program.
This video helps you see the impact of a tax from the point of view of welfare analysis.
When you understand consumer surplus, you can understand Uber’s pricing strategies.
Ever wonder about the crazy pricing of concert tickets? “Surge pricing” comes from elasticity analysis!
More arguments over kidney sale legalization.
It’s called “surveillance pricing” when businesses use your personal information (how much you shop for lower prices, how desperate you might be) to charge you higher prices on-line.
Media Attributions
- Bargain Tombstones © Arthur Rothstein is licensed under a Public Domain license
- Elastic curves © Bettina Berch is licensed under a CC BY-NC (Attribution NonCommercial) license
- Inelastic curves © Bettina Berch is licensed under a CC BY-NC (Attribution NonCommercial) license
- p x q is total revenue © Bettina Berch is licensed under a CC BY-NC (Attribution NonCommercial) license
- drug-policydecrease-supply2 © Bettina Berch is licensed under a CC BY-NC (Attribution NonCommercial) license
- Drug policy #2 Decrease demand © Bettina Berch is licensed under a CC BY-NC (Attribution NonCommercial) license
- welfare analysis © Bettina Berch is licensed under a CC BY-NC (Attribution NonCommercial) license
- kidney example © Bettina Berch is licensed under a CC BY-NC (Attribution NonCommercial) license
