Module 4: Nonlinear Models
Exponential Relationships (6 of 6)
Exponential Relationships (6 of 6)
Learning OUTCOMES
- Use an exponential model (when appropriate) to describe the relationship between two quantitative variables. Interpret the model in context.
Now we apply what we have learned about exponential decay to find a model for a set of data. We use a simulation to find appropriate values for C and b.
Here are the data we will investigate.
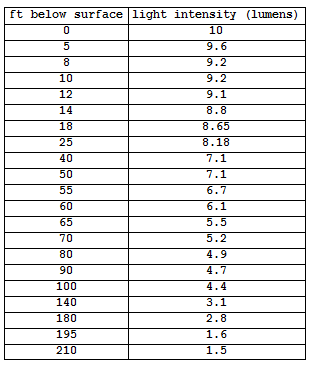
This table shows the data values, where x is the feet below the surface of the water and y is the predicted light intensity measured in lumens in a lake. We can see in the data that the amount of light transmitted through water decreases with depth. There is less light at greater depths.
Here are the data graphed in the scatterplot in the simulation. Notice that the light intensity has a fairly strong negative exponential form. Use the sliders in the simulation to adjust the values of C and b to find a reasonable exponential model that fits this data.
Click here to open this simulation in its own window.
Try It
- Concepts in Statistics. Provided by: Open Learning Initiative. Located at: http://oli.cmu.edu. License: CC BY: Attribution
