Module 2: Summarizing Data Graphically and Numerically
Introduction to Histograms
Introduction to Histograms
What you’ll learn to do: Describe the distribution of quantitative data using a histogram.
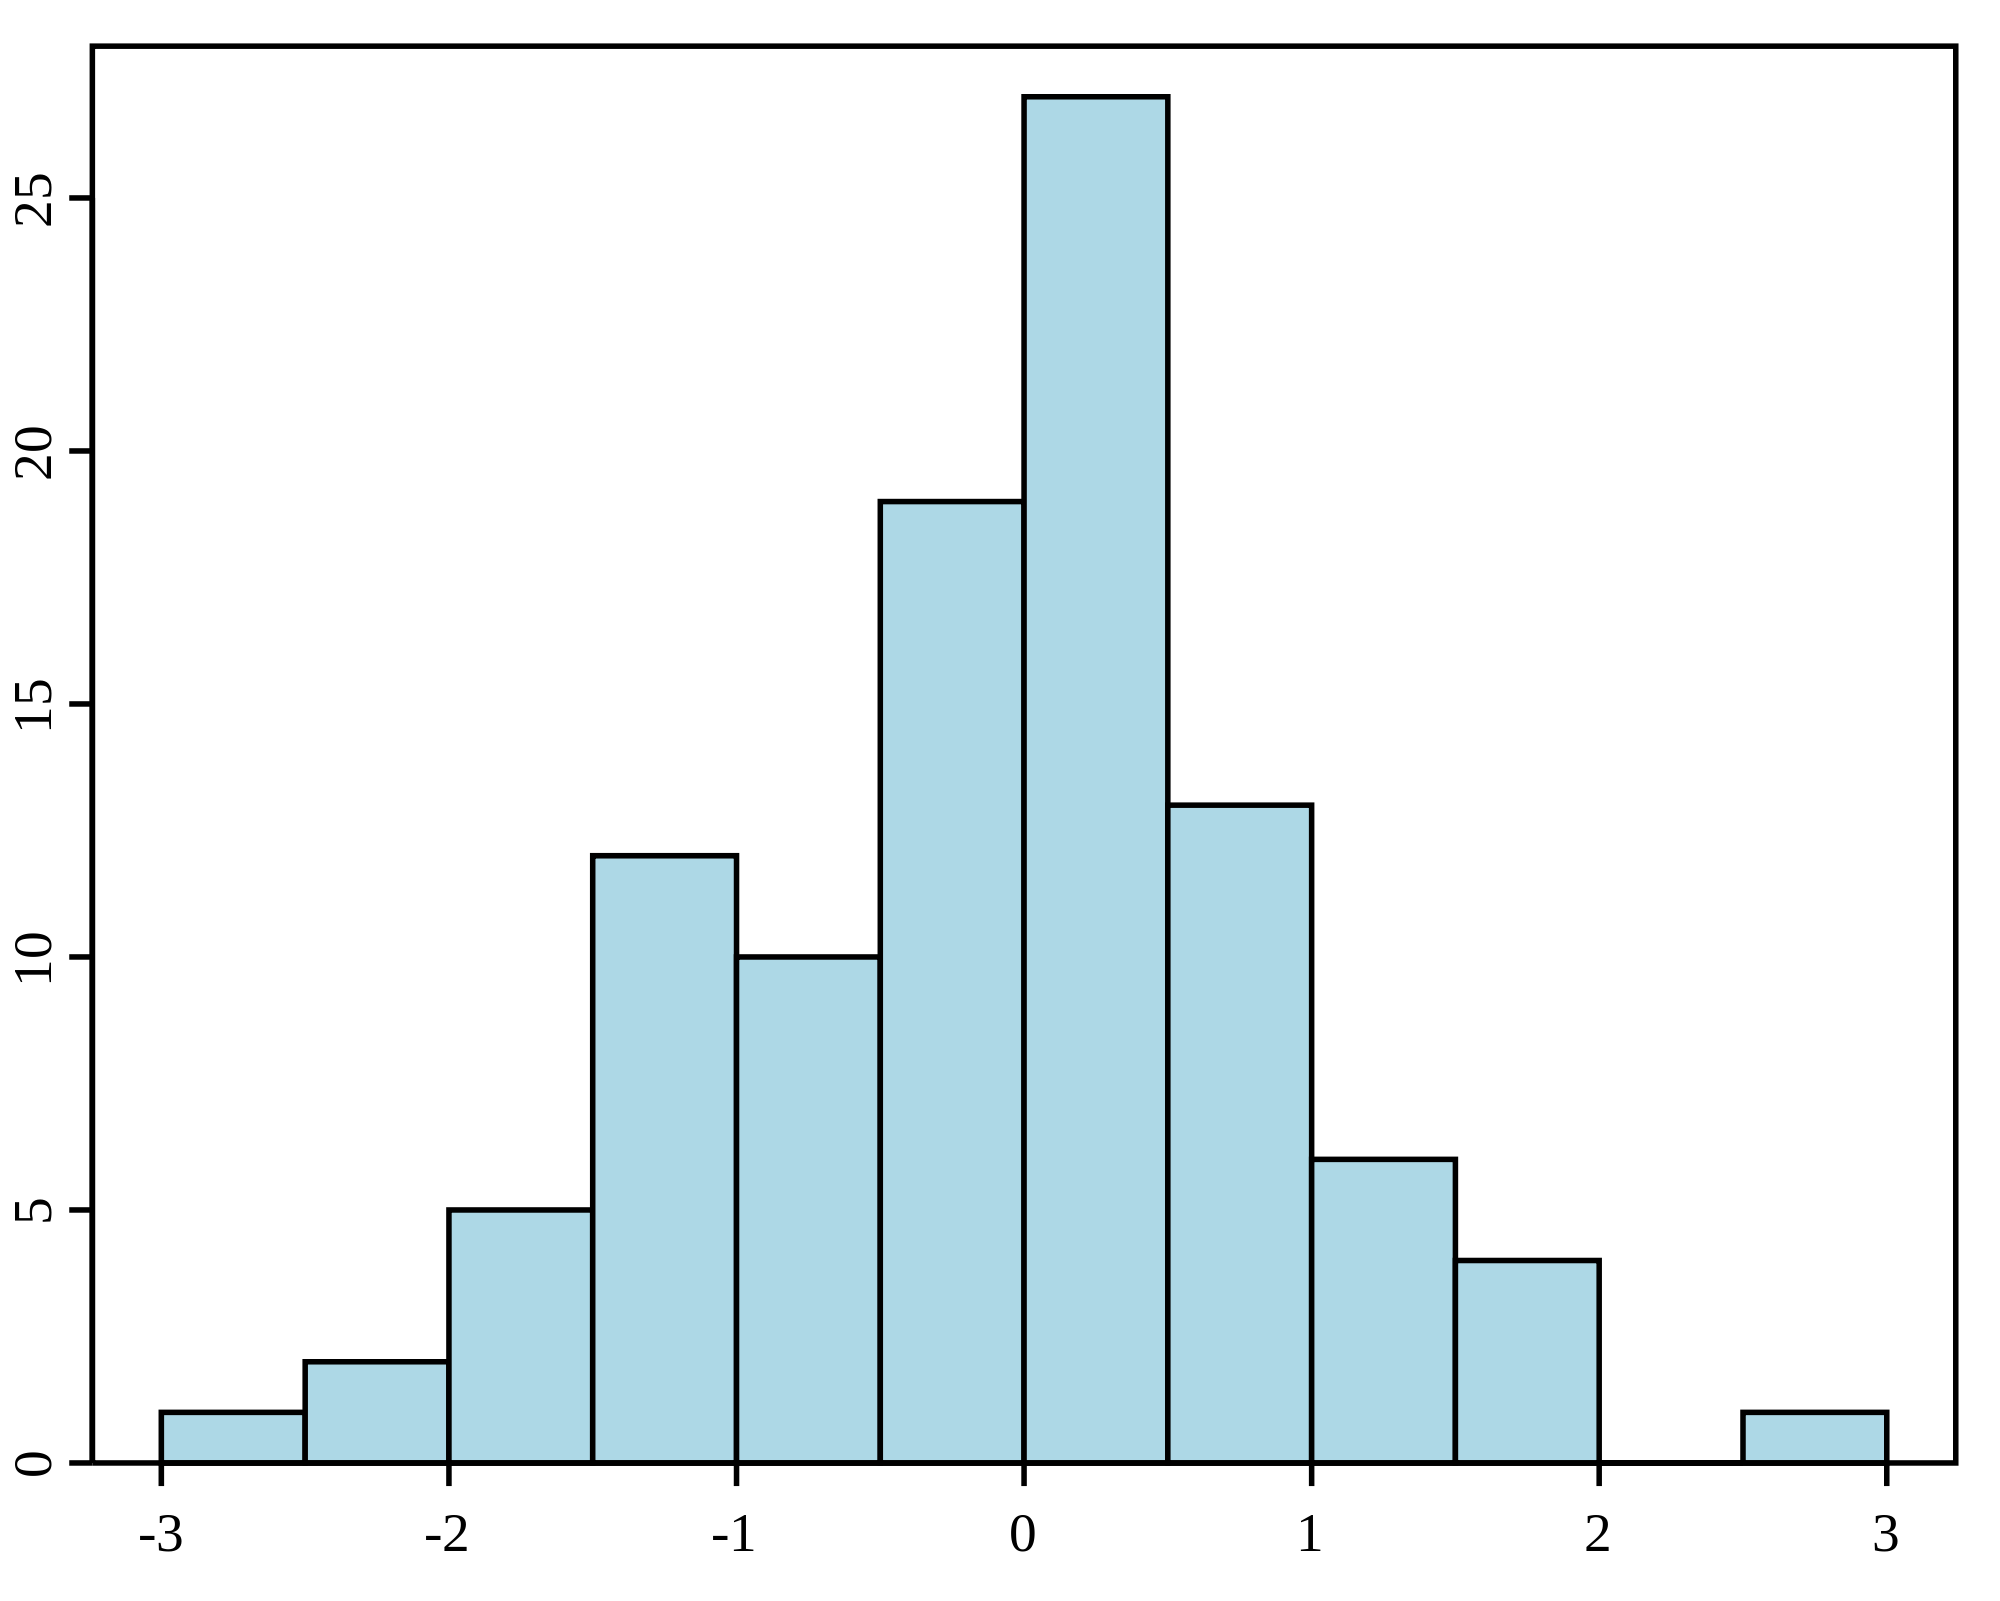
When presented with large data sets, the dotplot is sometimes cumbersome to put together. In addition, it may not be the cleanest way to present the data. For large datasets, a histogram can represent the numerous data points more simply as bars instead of an immense amount of data points in a dotplot. Similar to the dotplot, a histogram is useful in displaying the distribution (aka shape) of the data.
CC licensed content, Shared previously
- Concepts in Statistics. Provided by: Open Learning Initiative. Located at: http://oli.cmu.edu. License: CC BY: Attribution
