Module 3: Examining Relationships: Quantitative Data
Introduction to Linear Relationships
Introduction to Linear Relationships
What you’ll learn to do: Use a correlation coefficient to describe the direction and strength of a linear relationship. Recognize its limitations as a measure of the relationship between two quantitative variables.
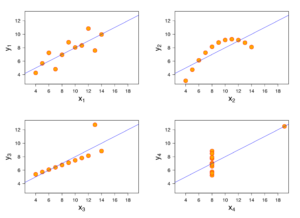 Scatterplots are an excellent way to visually inspect the data, but to further investigate the relationship, it would help to quantify some metrics about the relationship. In particular, we are interested in:
- Direction: Does the response variable increase with the dependent variable? Or does the response variable decrease with the dependent variable?
- Strength: Does the scatterplot cluster tightly around a line?
- Form: Is the scatterplot evenly clustered around the line or are there regions where the scatter is more spread out? Does the shape of the scatterplot seem linear or curvilinear?
CC licensed content, Shared previously
- Concepts in Statistics. Provided by: Open Learning Initiative. Located at: http://oli.cmu.edu. License: CC BY: Attribution
