Module 3: Examining Relationships: Quantitative Data
Introduction to Assessing the Fit of a Line
Introduction to Assessing the Fit of a Line
What you’ll learn to do: Use residuals, standard error, and r2 to assess the fit of a linear model.
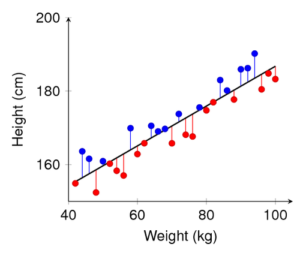 Graphing the regression line with the scatterplot gives a visual depiction of how well the regression line fits the data. To further hone in on assessing the fit of our regression line to the data, in this section we present:
- Residual plots.
- The correlation coefficient r gives us a numerical way to measure this fit.
- Interpreting the square of the correlation coefficient r2 .
- Interpreting the standard error se.
CC licensed content, Shared previously
- Concepts in Statistics. Provided by: Open Learning Initiative. Located at: http://oli.cmu.edu. License: CC BY: Attribution
