Module 2: Summarizing Data Graphically and Numerically
Introduction to Measures of Spread
Introduction to Measures of Spread
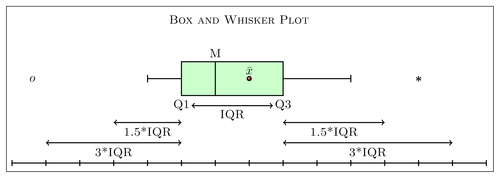
What you’ll learn to do: Use a five-number summary and a boxplot to describe a distribution.
In this section, we define ways to measure the spread of the data. If our measure of center is the median, we will use a visual interpretation with boxplots. If our measure of center is the mean, we will use something called standard deviation. In analyzing quantitative data, the measure of spread will be another key component.

CC licensed content, Shared previously
- Concepts in Statistics. Provided by: Open Learning Initiative. Located at: http://oli.cmu.edu. License: CC BY: Attribution
