Module 3: Examining Relationships: Quantitative Data
Introduction to Scatterplots
Introduction to Scatterplots
What you’ll learn to do: Use a scatterplot to display the relationship between two quantitative variables. Describe the overall pattern (form, direction, and strength) and striking deviations from the pattern.
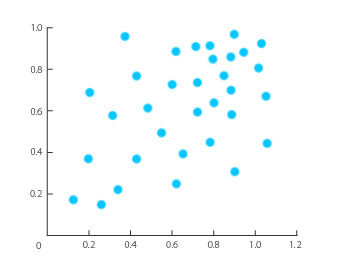
When investigating relationships between two quantitative variables, scatterplots are a simple way to visually represent the spread, direction, strength of relationship, and potential outliers of the data. With larger datasets, a scatterplot can more succinctly display the overall pattern than when the data are presented as a table. This visualization can also hint at the general shape of the relationship (for example, increasing linear, decreasing linear, or non-linear curves) while also helping us identify any deviations from that pattern.
CC licensed content, Shared previously
- Concepts in Statistics. Provided by: Open Learning Initiative. Located at: http://oli.cmu.edu. License: CC BY: Attribution
