Module 4: Nonlinear Models
Introduction to Exponential Relationships
Introduction to Exponential Relationships
What you’ll learn to do: Use an exponential model (when appropriate) to describe the relationship between two quantitative variables. Interpret the model in context.
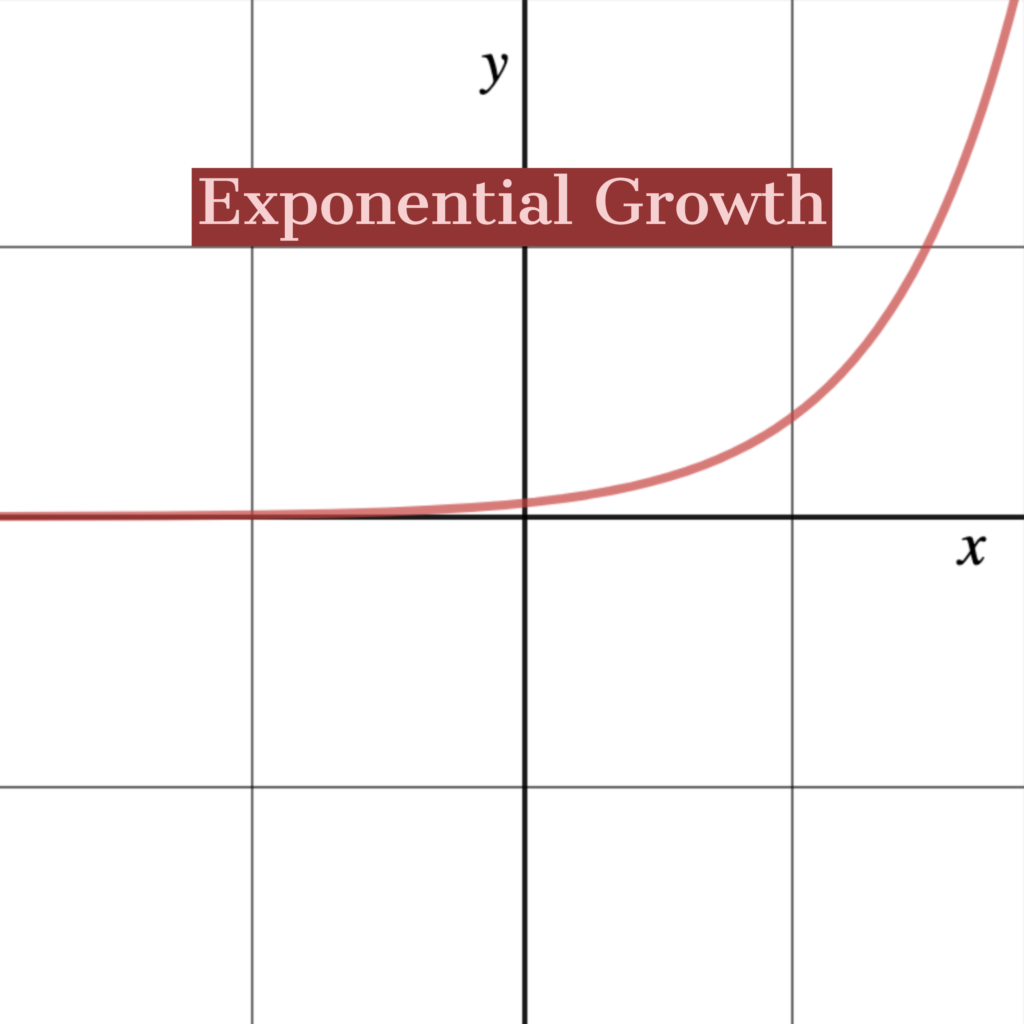
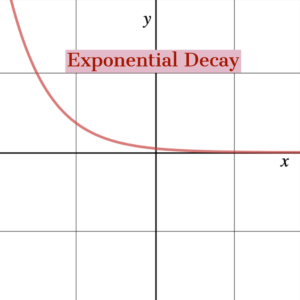
A common nonlinear model that occurs in real life is an exponential model, which is characterized by having a constant factor (or multiplier) for each constant increase in the dependent variable. Visually, the scatterplot of an exponential relationship should roughly follow a curve of one of these two shapes:
CC licensed content, Shared previously
- Concepts in Statistics. Provided by: Open Learning Initiative. Located at: http://oli.cmu.edu. License: CC BY: Attribution
