Module 2: Summarizing Data Graphically and Numerically
Introduction to Describing a Distribution
Introduction to Describing a Distribution
What you’ll learn to do: Describe a distribution using mean and standard deviation
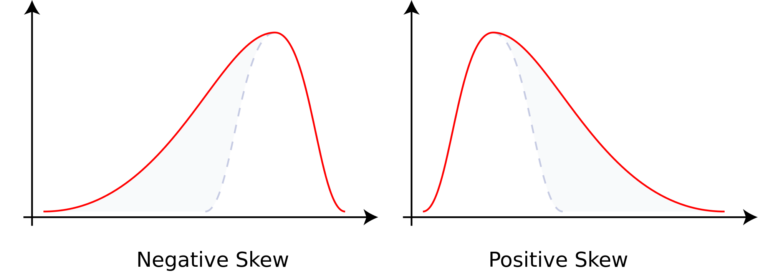
As important as proper study design, clearly representing data is a fundamental part of a good statistical analysis. In describing a distribution based on quantitative data, we present both numerical and graphical summaries. Putting our previous sections together, we first begin by visually representing the data in a dotplot or histogram. Based on the shape, skew, and outliers, appropriate measures of center and spread help us further understand the distribution.
CC licensed content, Shared previously
- Concepts in Statistics. Provided by: Open Learning Initiative. Located at: http://oli.cmu.edu. License: CC BY: Attribution
